

with increased distance from the observer. And clearly a specific size or size
distribution cannot be assumed without large uncertainty.
Drolshagen et al. (2017) attempted to overcome this issue by using the fact that
the narrow angle and wide angle cameras on Rosetta were deliberately set to the
greatest possible distance apart to allow for stereo acquisitions. In an example, the
parallax was used to determine the distance to a specific particle resulting in an error
of ~4% over 1.5 km. This approach is therefore accurate but limited in the distance
over which it is effective by the baseline distance between the two cameras. Ott et al.
(2017) subsequently used this approach for a data set with 262 large particles
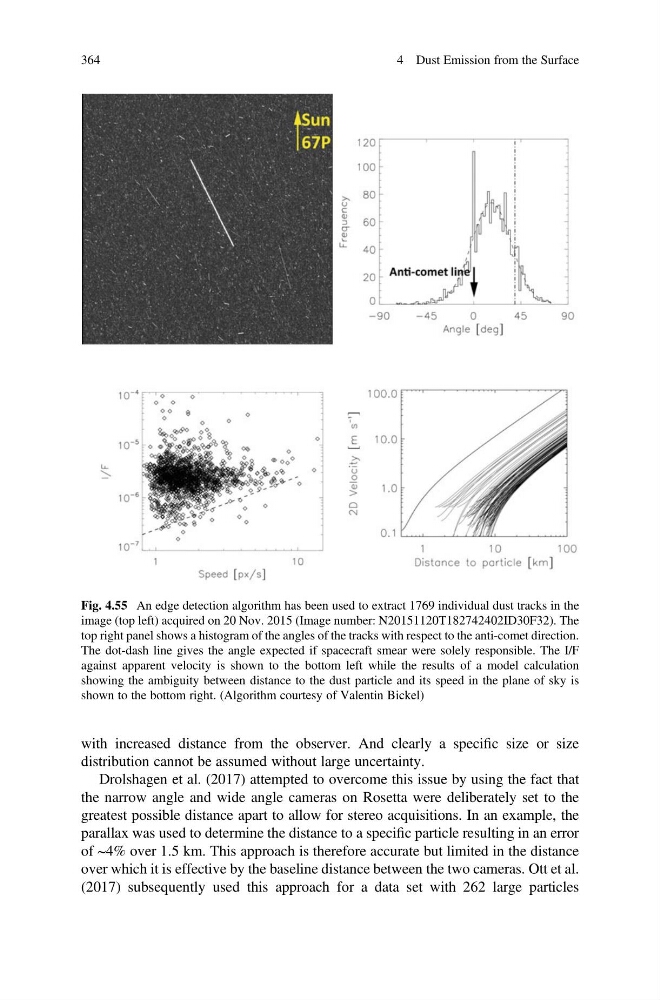
Fig. 4.55 An edge detection algorithm has been used to extract 1769 individual dust tracks in the
image (top left) acquired on 20 Nov. 2015 (Image number: N20151120T182742402ID30F32). The
top right panel shows a histogram of the angles of the tracks with respect to the anti-comet direction.
The dot-dash line gives the angle expected if spacecraft smear were solely responsible. The I/F
against apparent velocity is shown to the bottom left while the results of a model calculation
showing the ambiguity between distance to the dust particle and its speed in the plane of sky is
shown to the bottom right. (Algorithm courtesy of Valentin Bickel)
364
4 Dust Emission from the Surface
distribution cannot be assumed without large uncertainty.
Drolshagen et al. (2017) attempted to overcome this issue by using the fact that
the narrow angle and wide angle cameras on Rosetta were deliberately set to the
greatest possible distance apart to allow for stereo acquisitions. In an example, the
parallax was used to determine the distance to a specific particle resulting in an error
of ~4% over 1.5 km. This approach is therefore accurate but limited in the distance
over which it is effective by the baseline distance between the two cameras. Ott et al.
(2017) subsequently used this approach for a data set with 262 large particles
Fig. 4.55 An edge detection algorithm has been used to extract 1769 individual dust tracks in the
image (top left) acquired on 20 Nov. 2015 (Image number: N20151120T182742402ID30F32). The
top right panel shows a histogram of the angles of the tracks with respect to the anti-comet direction.
The dot-dash line gives the angle expected if spacecraft smear were solely responsible. The I/F
against apparent velocity is shown to the bottom left while the results of a model calculation
showing the ambiguity between distance to the dust particle and its speed in the plane of sky is
shown to the bottom right. (Algorithm courtesy of Valentin Bickel)
364
4 Dust Emission from the Surface