

additional gas source. Protopapa et al. (2014) concluded that within one nucleus
radius of the surface, dust dominated water ice by a factor of ten but that the water ice
and the dust were not uniformly distributed. The lifetime of pure water ice particles is
long compared to typical outflow timescales (see below) but impurities may modify
this. Hence, there is a case for including extended sources from dust in gas dynamics
schemes. However, other claims of evidence of sublimation effects in the innermost
coma are, at this point, less quantitative or dubious.
4.8 Converting Afρ to a Dust Loss Rate
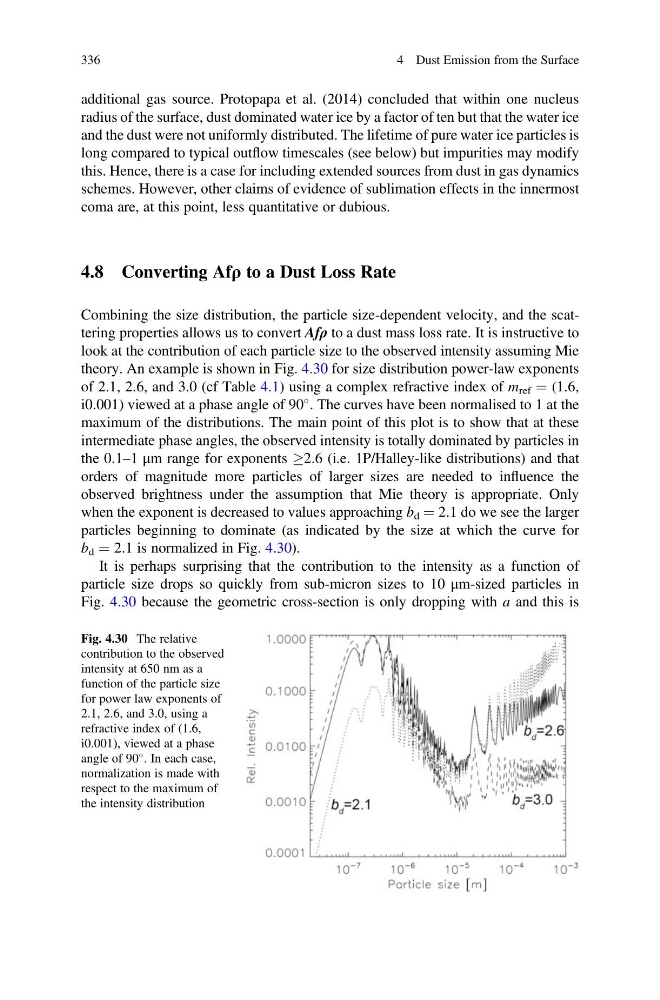
Combining the size distribution, the particle size-dependent velocity, and the scattering properties allows us to convert Afρ to a dust mass loss rate. It is instructive to
look at the contribution of each particle size to the observed intensity assuming Mie
theory. An example is shown in Fig. 4.30 for size distribution power-law exponents
of 2.1, 2.6, and 3.0 (cf Table 4.1) using a complex refractive index of m ref ¼ (1.6,
i0.001) viewed at a phase angle of 90
. The curves have been normalised to 1 at the
maximum of the distributions. The main point of this plot is to show that at these
intermediate phase angles, the observed intensity is totally dominated by particles in
the 0.1–1 μm range for exponents !2.6 (i.e. 1P/Halley-like distributions) and that
orders of magnitude more particles of larger sizes are needed to influence the
observed brightness under the assumption that Mie theory is appropriate. Only
when the exponent is decreased to values approaching b d ¼ 2.1 do we see the larger
particles beginning to dominate (as indicated by the size at which the curve for
b d ¼ 2.1 is normalized in Fig. 4.30).
It is perhaps surprising that the contribution to the intensity as a function of
particle size drops so quickly from sub-micron sizes to 10 μm-sized particles in
Fig. 4.30 because the geometric cross-section is only dropping with a and this is
Fig. 4.30 The relative
contribution to the observed
intensity at 650 nm as a
function of the particle size
for power law exponents of
2.1, 2.6, and 3.0, using a
refractive index of (1.6,
i0.001), viewed at a phase
angle of 90
. In each case,
normalization is made with
respect to the maximum of
the intensity distribution
336
4 Dust Emission from the Surface
radius of the surface, dust dominated water ice by a factor of ten but that the water ice
and the dust were not uniformly distributed. The lifetime of pure water ice particles is
long compared to typical outflow timescales (see below) but impurities may modify
this. Hence, there is a case for including extended sources from dust in gas dynamics
schemes. However, other claims of evidence of sublimation effects in the innermost
coma are, at this point, less quantitative or dubious.
4.8 Converting Afρ to a Dust Loss Rate
Combining the size distribution, the particle size-dependent velocity, and the scattering properties allows us to convert Afρ to a dust mass loss rate. It is instructive to
look at the contribution of each particle size to the observed intensity assuming Mie
theory. An example is shown in Fig. 4.30 for size distribution power-law exponents
of 2.1, 2.6, and 3.0 (cf Table 4.1) using a complex refractive index of m ref ¼ (1.6,
i0.001) viewed at a phase angle of 90
. The curves have been normalised to 1 at the
maximum of the distributions. The main point of this plot is to show that at these
intermediate phase angles, the observed intensity is totally dominated by particles in
the 0.1–1 μm range for exponents !2.6 (i.e. 1P/Halley-like distributions) and that
orders of magnitude more particles of larger sizes are needed to influence the
observed brightness under the assumption that Mie theory is appropriate. Only
when the exponent is decreased to values approaching b d ¼ 2.1 do we see the larger
particles beginning to dominate (as indicated by the size at which the curve for
b d ¼ 2.1 is normalized in Fig. 4.30).
It is perhaps surprising that the contribution to the intensity as a function of
particle size drops so quickly from sub-micron sizes to 10 μm-sized particles in
Fig. 4.30 because the geometric cross-section is only dropping with a and this is
Fig. 4.30 The relative
contribution to the observed
intensity at 650 nm as a
function of the particle size
for power law exponents of
2.1, 2.6, and 3.0, using a
refractive index of (1.6,
i0.001), viewed at a phase
angle of 90
. In each case,
normalization is made with
respect to the maximum of
the intensity distribution
336
4 Dust Emission from the Surface