

We saw in Fig. 3.28, that local CO, CO 2 and H 2 O densities in the innermost coma
vary with respect to each other in Rosetta/ROSINA data. Hässig et al. (2015)
extrapolated ROSINA in situ observations from late 2014 back to the nucleus
assuming free molecular flow and concluded that the CO 2 /H 2 O production rate
ratio was at a maximum in or near the Imhotep region (Fig. 2.88). Prior to equinox
pre-perihelion, there was a broadly illumination-driven source for H 2 O but with a
maximum in emission from the neck (Hapi) region. However, CO 2 emission was
more diffuse. A similar conclusion was reached by Migliorini et al. (2016) who used
Rosetta/VIRTIS data for 67P in April 2015. The ROSINA measurements suggested
that, in this early phase, CO 2 could dominate H 2 O production from the poorly
illuminated southern hemisphere. Hoang et al. (2017), using data from the period
between November 2014 and February 2015 showed that the CO/H 2 O ratio was
highest (>0.3–0.4) in the Imhotep, Khonsu, Wosret, Neith, and Sobek regions,
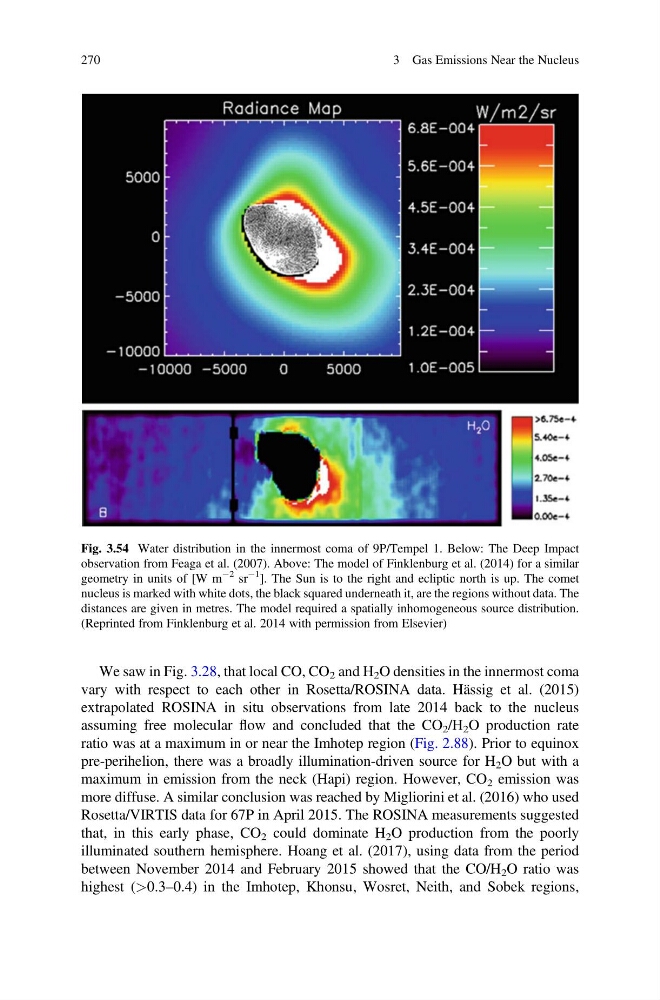
Fig. 3.54 Water distribution in the innermost coma of 9P/Tempel 1. Below: The Deep Impact
observation from Feaga et al. (2007). Above: The model of Finklenburg et al. (2014) for a similar
geometry in units of [W m
À2 sr
À1
]. The Sun is to the right and ecliptic north is up. The comet
nucleus is marked with white dots, the black squared underneath it, are the regions without data. The
distances are given in metres. The model required a spatially inhomogeneous source distribution.
(Reprinted from Finklenburg et al. 2014 with permission from Elsevier)
270
3 Gas Emissions Near the Nucleus
vary with respect to each other in Rosetta/ROSINA data. Hässig et al. (2015)
extrapolated ROSINA in situ observations from late 2014 back to the nucleus
assuming free molecular flow and concluded that the CO 2 /H 2 O production rate
ratio was at a maximum in or near the Imhotep region (Fig. 2.88). Prior to equinox
pre-perihelion, there was a broadly illumination-driven source for H 2 O but with a
maximum in emission from the neck (Hapi) region. However, CO 2 emission was
more diffuse. A similar conclusion was reached by Migliorini et al. (2016) who used
Rosetta/VIRTIS data for 67P in April 2015. The ROSINA measurements suggested
that, in this early phase, CO 2 could dominate H 2 O production from the poorly
illuminated southern hemisphere. Hoang et al. (2017), using data from the period
between November 2014 and February 2015 showed that the CO/H 2 O ratio was
highest (>0.3–0.4) in the Imhotep, Khonsu, Wosret, Neith, and Sobek regions,
Fig. 3.54 Water distribution in the innermost coma of 9P/Tempel 1. Below: The Deep Impact
observation from Feaga et al. (2007). Above: The model of Finklenburg et al. (2014) for a similar
geometry in units of [W m
À2 sr
À1
]. The Sun is to the right and ecliptic north is up. The comet
nucleus is marked with white dots, the black squared underneath it, are the regions without data. The
distances are given in metres. The model required a spatially inhomogeneous source distribution.
(Reprinted from Finklenburg et al. 2014 with permission from Elsevier)
270
3 Gas Emissions Near the Nucleus