

There are also 3-generation Haser models (e.g. O’Dell et al. 1988) but these suffer
from the same deficiencies.
The observations of daughter species such as CN, C 3 , and C 2 are interesting for
comparison between comets. The most significant radical, however, is OH because
its production rate can be used as a tracer for the parent water molecule from which
the water production rate of the comet can be derived. The strong A
2
∑ À X
2 II (0, 0)
emission band in the near-UV at 308.6 nm arises from resonant fluorescence and it
provides an immediate tool to monitor the water production rate and its variations
with the comet’s heliocentric distance, rotational period and activity changes. An
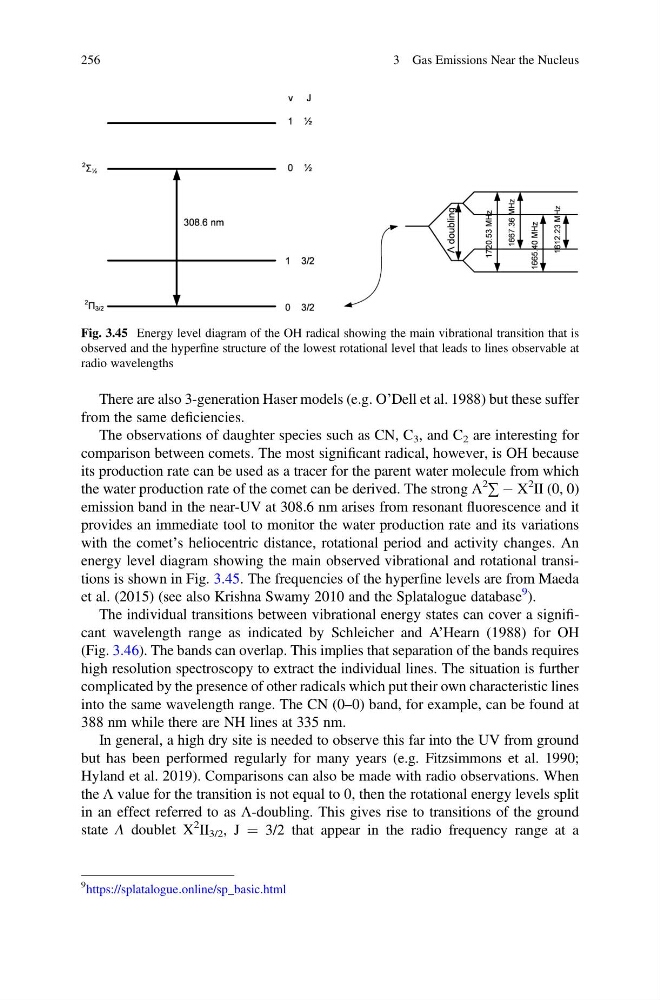
energy level diagram showing the main observed vibrational and rotational transitions is shown in Fig. 3.45. The frequencies of the hyperfine levels are from Maeda
et al. (2015) (see also Krishna Swamy 2010 and the Splatalogue database
9 ).
The individual transitions between vibrational energy states can cover a significant wavelength range as indicated by Schleicher and A’Hearn (1988) for OH
(Fig. 3.46). The bands can overlap. This implies that separation of the bands requires
high resolution spectroscopy to extract the individual lines. The situation is further
complicated by the presence of other radicals which put their own characteristic lines
into the same wavelength range. The CN (0–0) band, for example, can be found at
388 nm while there are NH lines at 335 nm.
In general, a high dry site is needed to observe this far into the UV from ground
but has been performed regularly for many years (e.g. Fitzsimmons et al. 1990;
Hyland et al. 2019). Comparisons can also be made with radio observations. When
the Λ value for the transition is not equal to 0, then the rotational energy levels split
in an effect referred to as Λ-doubling. This gives rise to transitions of the ground
state Λ doublet X
2 II 3/2 , J ¼ 3/2 that appear in the radio frequency range at a
Fig. 3.45 Energy level diagram of the OH radical showing the main vibrational transition that is
observed and the hyperfine structure of the lowest rotational level that leads to lines observable at
radio wavelengths
9 https://splatalogue.online/sp_basic.html
256
3 Gas Emissions Near the Nucleus
from the same deficiencies.
The observations of daughter species such as CN, C 3 , and C 2 are interesting for
comparison between comets. The most significant radical, however, is OH because
its production rate can be used as a tracer for the parent water molecule from which
the water production rate of the comet can be derived. The strong A
2
∑ À X
2 II (0, 0)
emission band in the near-UV at 308.6 nm arises from resonant fluorescence and it
provides an immediate tool to monitor the water production rate and its variations
with the comet’s heliocentric distance, rotational period and activity changes. An
energy level diagram showing the main observed vibrational and rotational transitions is shown in Fig. 3.45. The frequencies of the hyperfine levels are from Maeda
et al. (2015) (see also Krishna Swamy 2010 and the Splatalogue database
9 ).
The individual transitions between vibrational energy states can cover a significant wavelength range as indicated by Schleicher and A’Hearn (1988) for OH
(Fig. 3.46). The bands can overlap. This implies that separation of the bands requires
high resolution spectroscopy to extract the individual lines. The situation is further
complicated by the presence of other radicals which put their own characteristic lines
into the same wavelength range. The CN (0–0) band, for example, can be found at
388 nm while there are NH lines at 335 nm.
In general, a high dry site is needed to observe this far into the UV from ground
but has been performed regularly for many years (e.g. Fitzsimmons et al. 1990;
Hyland et al. 2019). Comparisons can also be made with radio observations. When
the Λ value for the transition is not equal to 0, then the rotational energy levels split
in an effect referred to as Λ-doubling. This gives rise to transitions of the ground
state Λ doublet X
2 II 3/2 , J ¼ 3/2 that appear in the radio frequency range at a
Fig. 3.45 Energy level diagram of the OH radical showing the main vibrational transition that is
observed and the hyperfine structure of the lowest rotational level that leads to lines observable at
radio wavelengths
9 https://splatalogue.online/sp_basic.html
256
3 Gas Emissions Near the Nucleus