

In Fig. 3.39, a simple calculation of the CO 2 sublimation rate at the equator for
different idealised surface conditions is shown. Here, the position of a CO 2 sublimation front relative to the surface and the thermal inertia of the inert layer above this
sublimation front have been modified to look at their influence on the CO 2 sublimation rate. It can be seen that low thermal inertia combined with sublimation from a
depth of about 10 cm can smooth out the CO 2 production rate with rotational phase
so that nightside CO 2 production is comparable to that seen on the dayside and at a
relatively high level. Consequently, CO 2 emission through a porous inert layer may
be a significant contributor to nightside gas production and modifying the CO 2 to
H 2 O density ratio locally in the coma.
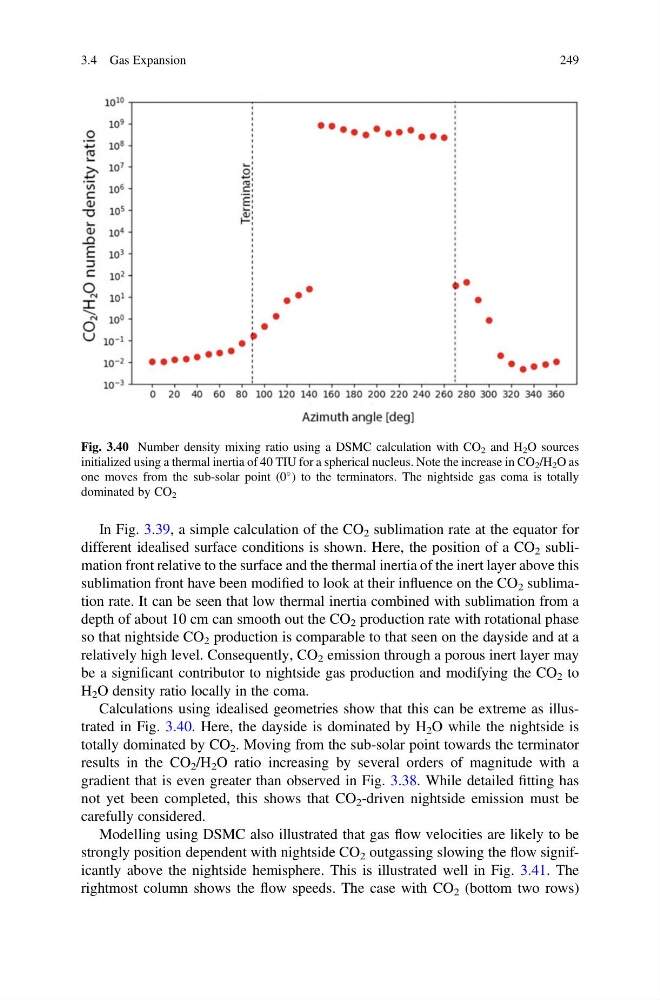
Calculations using idealised geometries show that this can be extreme as illustrated in Fig. 3.40. Here, the dayside is dominated by H 2 O while the nightside is
totally dominated by CO 2 . Moving from the sub-solar point towards the terminator
results in the CO 2 /H 2 O ratio increasing by several orders of magnitude with a
gradient that is even greater than observed in Fig. 3.38. While detailed fitting has
not yet been completed, this shows that CO 2 -driven nightside emission must be
carefully considered.
Modelling using DSMC also illustrated that gas flow velocities are likely to be
strongly position dependent with nightside CO 2 outgassing slowing the flow significantly above the nightside hemisphere. This is illustrated well in Fig. 3.41. The
rightmost column shows the flow speeds. The case with CO 2 (bottom two rows)
Fig. 3.40 Number density mixing ratio using a DSMC calculation with CO 2 and H 2 O sources
initialized using a thermal inertia of 40 TIU for a spherical nucleus. Note the increase in CO 2 /H 2 O as
one moves from the sub-solar point (0
) to the terminators. The nightside gas coma is totally
dominated by CO 2
3.4 Gas Expansion
249
different idealised surface conditions is shown. Here, the position of a CO 2 sublimation front relative to the surface and the thermal inertia of the inert layer above this
sublimation front have been modified to look at their influence on the CO 2 sublimation rate. It can be seen that low thermal inertia combined with sublimation from a
depth of about 10 cm can smooth out the CO 2 production rate with rotational phase
so that nightside CO 2 production is comparable to that seen on the dayside and at a
relatively high level. Consequently, CO 2 emission through a porous inert layer may
be a significant contributor to nightside gas production and modifying the CO 2 to
H 2 O density ratio locally in the coma.
Calculations using idealised geometries show that this can be extreme as illustrated in Fig. 3.40. Here, the dayside is dominated by H 2 O while the nightside is
totally dominated by CO 2 . Moving from the sub-solar point towards the terminator
results in the CO 2 /H 2 O ratio increasing by several orders of magnitude with a
gradient that is even greater than observed in Fig. 3.38. While detailed fitting has
not yet been completed, this shows that CO 2 -driven nightside emission must be
carefully considered.
Modelling using DSMC also illustrated that gas flow velocities are likely to be
strongly position dependent with nightside CO 2 outgassing slowing the flow significantly above the nightside hemisphere. This is illustrated well in Fig. 3.41. The
rightmost column shows the flow speeds. The case with CO 2 (bottom two rows)
Fig. 3.40 Number density mixing ratio using a DSMC calculation with CO 2 and H 2 O sources
initialized using a thermal inertia of 40 TIU for a spherical nucleus. Note the increase in CO 2 /H 2 O as
one moves from the sub-solar point (0
) to the terminators. The nightside gas coma is totally
dominated by CO 2
3.4 Gas Expansion
249