

correlation. On the other hand, the rather clear trends through to 105
suggest that
using Eq. (2.91) with CO 2 as the subliming volatile should be considered.
Bockelée-Morvan et al. (2015) suggested that VIRTIS-H observations of the
varying CO 2 to H 2 O ratios when comparing spectra acquired above the dayside
and nightside limbs might be explained by CO 2 emission from below the thermal
skin depth. We can use the thermal model in Sect. 2.9.3.1 to explore this in a little
more detail.
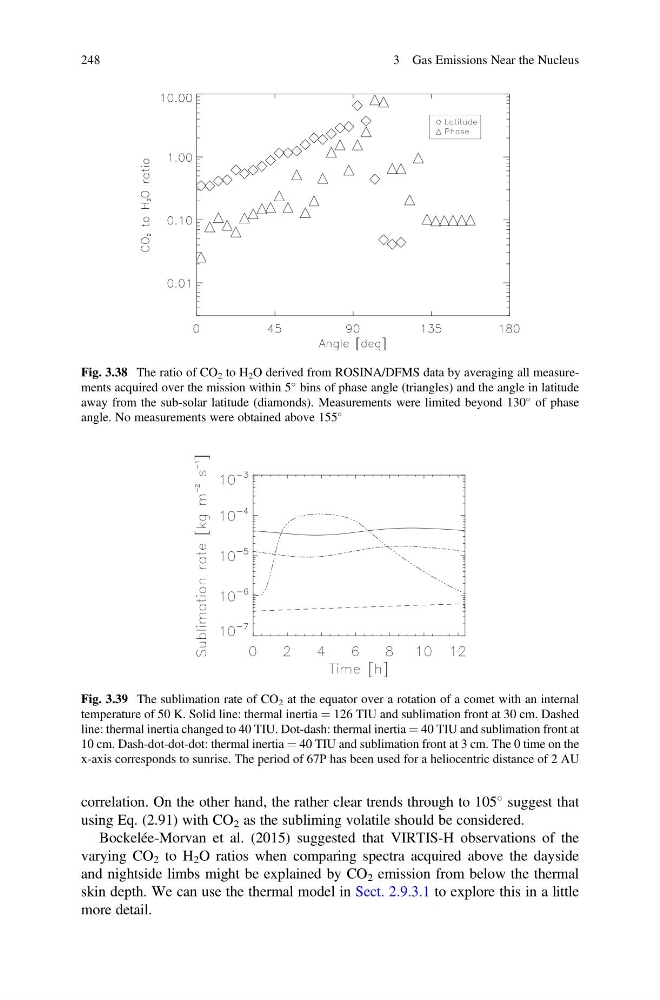
Fig. 3.39 The sublimation rate of CO 2 at the equator over a rotation of a comet with an internal
temperature of 50 K. Solid line: thermal inertia ¼ 126 TIU and sublimation front at 30 cm. Dashed
line: thermal inertia changed to 40 TIU. Dot-dash: thermal inertia ¼ 40 TIU and sublimation front at
10 cm. Dash-dot-dot-dot: thermal inertia ¼ 40 TIU and sublimation front at 3 cm. The 0 time on the
x-axis corresponds to sunrise. The period of 67P has been used for a heliocentric distance of 2 AU
Fig. 3.38 The ratio of CO 2 to H 2 O derived from ROSINA/DFMS data by averaging all measurements acquired over the mission within 5
bins of phase angle (triangles) and the angle in latitude
away from the sub-solar latitude (diamonds). Measurements were limited beyond 130
of phase
angle. No measurements were obtained above 155
248
3 Gas Emissions Near the Nucleus
suggest that
using Eq. (2.91) with CO 2 as the subliming volatile should be considered.
Bockelée-Morvan et al. (2015) suggested that VIRTIS-H observations of the
varying CO 2 to H 2 O ratios when comparing spectra acquired above the dayside
and nightside limbs might be explained by CO 2 emission from below the thermal
skin depth. We can use the thermal model in Sect. 2.9.3.1 to explore this in a little
more detail.
Fig. 3.39 The sublimation rate of CO 2 at the equator over a rotation of a comet with an internal
temperature of 50 K. Solid line: thermal inertia ¼ 126 TIU and sublimation front at 30 cm. Dashed
line: thermal inertia changed to 40 TIU. Dot-dash: thermal inertia ¼ 40 TIU and sublimation front at
10 cm. Dash-dot-dot-dot: thermal inertia ¼ 40 TIU and sublimation front at 3 cm. The 0 time on the
x-axis corresponds to sunrise. The period of 67P has been used for a heliocentric distance of 2 AU
Fig. 3.38 The ratio of CO 2 to H 2 O derived from ROSINA/DFMS data by averaging all measurements acquired over the mission within 5
bins of phase angle (triangles) and the angle in latitude
away from the sub-solar latitude (diamonds). Measurements were limited beyond 130
of phase
angle. No measurements were obtained above 155
248
3 Gas Emissions Near the Nucleus