

Z T ¼
X
l
w l e
À
E l
kT
ð3:37Þ
The temperature dependence is significant (Villanueva et al. 2012). The rapid
expansion of the gas in the inner coma leads to a cooling that reduces the temperature
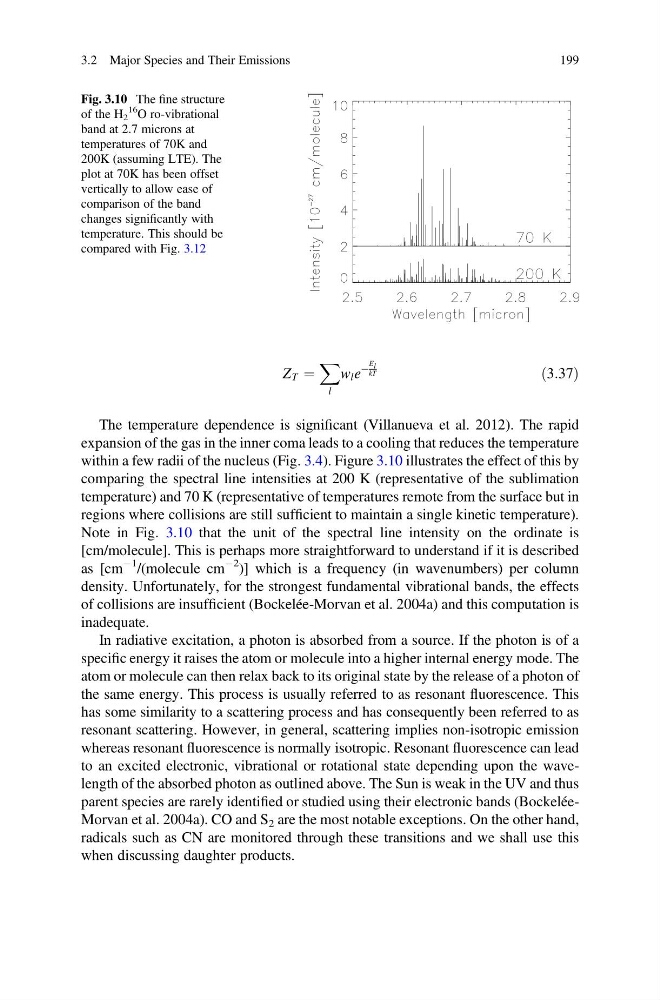
within a few radii of the nucleus (Fig. 3.4). Figure 3.10 illustrates the effect of this by
comparing the spectral line intensities at 200 K (representative of the sublimation
temperature) and 70 K (representative of temperatures remote from the surface but in
regions where collisions are still sufficient to maintain a single kinetic temperature).
Note in Fig. 3.10 that the unit of the spectral line intensity on the ordinate is
[cm/molecule]. This is perhaps more straightforward to understand if it is described
as [cm
À1 /(molecule cm
À2 )] which is a frequency (in wavenumbers) per column
density. Unfortunately, for the strongest fundamental vibrational bands, the effects
of collisions are insufficient (Bockelée-Morvan et al. 2004a) and this computation is
inadequate.
In radiative excitation, a photon is absorbed from a source. If the photon is of a
specific energy it raises the atom or molecule into a higher internal energy mode. The
atom or molecule can then relax back to its original state by the release of a photon of
the same energy. This process is usually referred to as resonant fluorescence. This
has some similarity to a scattering process and has consequently been referred to as
resonant scattering. However, in general, scattering implies non-isotropic emission
whereas resonant fluorescence is normally isotropic. Resonant fluorescence can lead
to an excited electronic, vibrational or rotational state depending upon the wavelength of the absorbed photon as outlined above. The Sun is weak in the UV and thus
parent species are rarely identified or studied using their electronic bands (BockeléeMorvan et al. 2004a). CO and S 2 are the most notable exceptions. On the other hand,
radicals such as CN are monitored through these transitions and we shall use this
when discussing daughter products.
Fig. 3.10 The fine structure
of the H 2
16
O ro-vibrational
band at 2.7 microns at
temperatures of 70K and
200K (assuming LTE). The
plot at 70K has been offset
vertically to allow ease of
comparison of the band
changes significantly with
temperature. This should be
compared with Fig. 3.12
3.2 Major Species and Their Emissions
199
X
l
w l e
À
E l
kT
ð3:37Þ
The temperature dependence is significant (Villanueva et al. 2012). The rapid
expansion of the gas in the inner coma leads to a cooling that reduces the temperature
within a few radii of the nucleus (Fig. 3.4). Figure 3.10 illustrates the effect of this by
comparing the spectral line intensities at 200 K (representative of the sublimation
temperature) and 70 K (representative of temperatures remote from the surface but in
regions where collisions are still sufficient to maintain a single kinetic temperature).
Note in Fig. 3.10 that the unit of the spectral line intensity on the ordinate is
[cm/molecule]. This is perhaps more straightforward to understand if it is described
as [cm
À1 /(molecule cm
À2 )] which is a frequency (in wavenumbers) per column
density. Unfortunately, for the strongest fundamental vibrational bands, the effects
of collisions are insufficient (Bockelée-Morvan et al. 2004a) and this computation is
inadequate.
In radiative excitation, a photon is absorbed from a source. If the photon is of a
specific energy it raises the atom or molecule into a higher internal energy mode. The
atom or molecule can then relax back to its original state by the release of a photon of
the same energy. This process is usually referred to as resonant fluorescence. This
has some similarity to a scattering process and has consequently been referred to as
resonant scattering. However, in general, scattering implies non-isotropic emission
whereas resonant fluorescence is normally isotropic. Resonant fluorescence can lead
to an excited electronic, vibrational or rotational state depending upon the wavelength of the absorbed photon as outlined above. The Sun is weak in the UV and thus
parent species are rarely identified or studied using their electronic bands (BockeléeMorvan et al. 2004a). CO and S 2 are the most notable exceptions. On the other hand,
radicals such as CN are monitored through these transitions and we shall use this
when discussing daughter products.
Fig. 3.10 The fine structure
of the H 2
16
O ro-vibrational
band at 2.7 microns at
temperatures of 70K and
200K (assuming LTE). The
plot at 70K has been offset
vertically to allow ease of
comparison of the band
changes significantly with
temperature. This should be
compared with Fig. 3.12
3.2 Major Species and Their Emissions
199