

Fig. 2.103
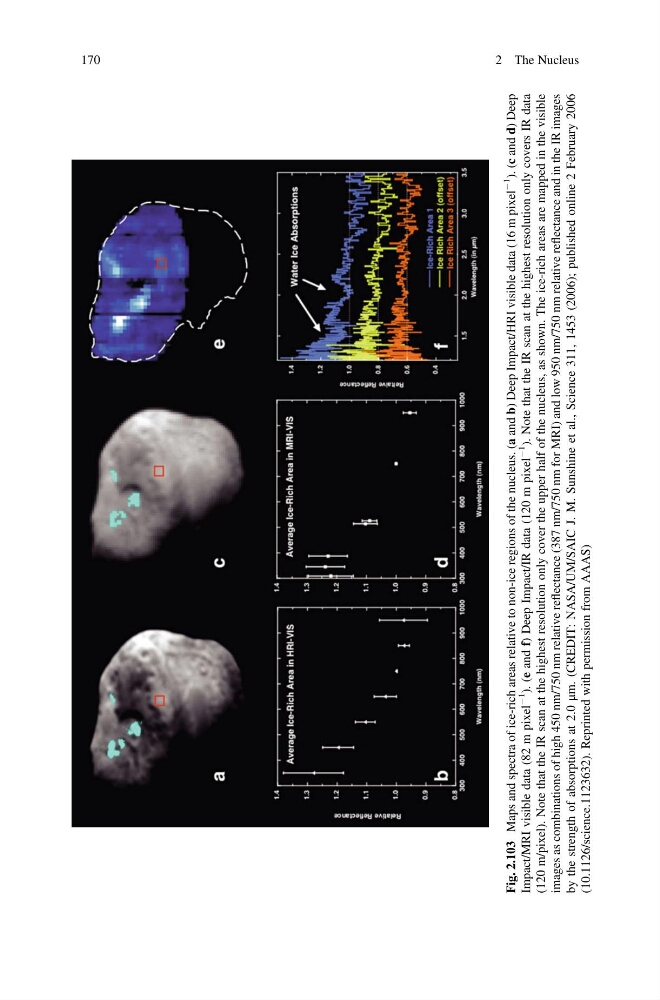
Maps and spectra of ice-rich areas relative to non-ice regions of the nucleus. (a and b)
Deep Impact/HRI visible data (16 m pixel
À1
). (c and d)
Deep
Impact/MRI visible data (82 m pixel
À1
). (e and f)
Deep Impact/IR data (120 m pixel
À1
). Note that the IR scan at the highest resolution only covers IR data
(120 m/pixel). Note that the IR scan at the highest resolution only cover the upper half of the nucleus, as shown. The ice-rich areas are mapped in the visible
images as combinations of high 450 nm/750 nm relative reflectance (387 nm/750 nm for MRI) and low 950 nm/750 nm relative reflectance and in the IR images
by the strength of absorptions at 2.0
μm. (CREDIT: NASA/UM/SAIC J. M. Sunshine et al., Science 311, 1453 (2006); published online 2 February 2006
(10.1126/science.1123632). Reprinted with permission from AAAS)
170
2 The Nucleus
Maps and spectra of ice-rich areas relative to non-ice regions of the nucleus. (a and b)
Deep Impact/HRI visible data (16 m pixel
À1
). (c and d)
Deep
Impact/MRI visible data (82 m pixel
À1
). (e and f)
Deep Impact/IR data (120 m pixel
À1
). Note that the IR scan at the highest resolution only covers IR data
(120 m/pixel). Note that the IR scan at the highest resolution only cover the upper half of the nucleus, as shown. The ice-rich areas are mapped in the visible
images as combinations of high 450 nm/750 nm relative reflectance (387 nm/750 nm for MRI) and low 950 nm/750 nm relative reflectance and in the IR images
by the strength of absorptions at 2.0
μm. (CREDIT: NASA/UM/SAIC J. M. Sunshine et al., Science 311, 1453 (2006); published online 2 February 2006
(10.1126/science.1123632). Reprinted with permission from AAAS)
170
2 The Nucleus