

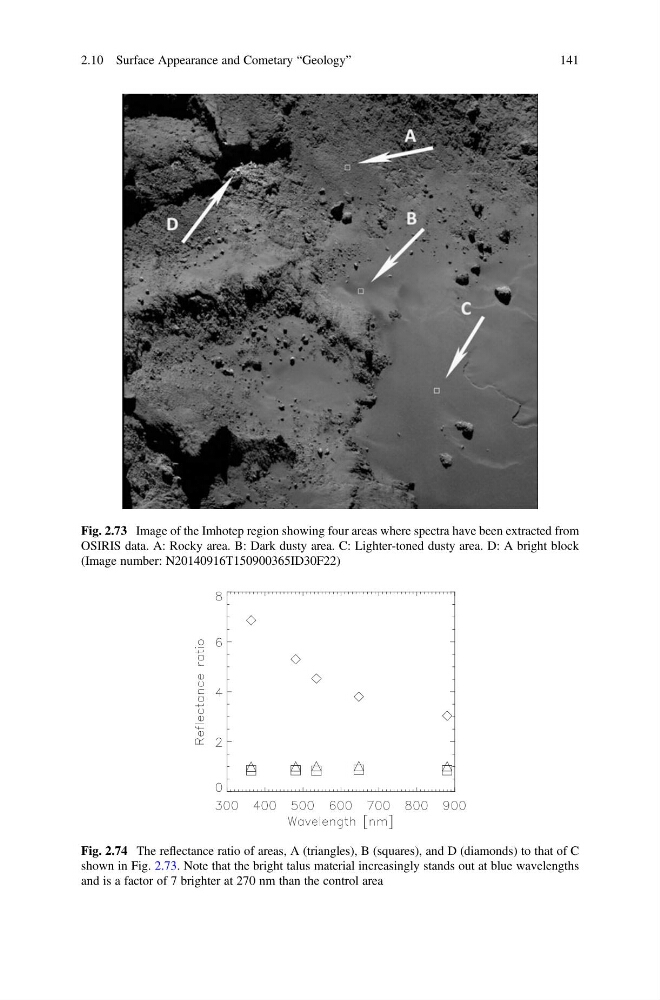
Fig. 2.74 The reflectance ratio of areas, A (triangles), B (squares), and D (diamonds) to that of C
shown in Fig. 2.73. Note that the bright talus material increasingly stands out at blue wavelengths
and is a factor of 7 brighter at 270 nm than the control area
Fig. 2.73 Image of the Imhotep region showing four areas where spectra have been extracted from
OSIRIS data. A: Rocky area. B: Dark dusty area. C: Lighter-toned dusty area. D: A bright block
(Image number: N20140916T150900365ID30F22)
2.10 Surface Appearance and Cometary “Geology”
141
shown in Fig. 2.73. Note that the bright talus material increasingly stands out at blue wavelengths
and is a factor of 7 brighter at 270 nm than the control area
Fig. 2.73 Image of the Imhotep region showing four areas where spectra have been extracted from
OSIRIS data. A: Rocky area. B: Dark dusty area. C: Lighter-toned dusty area. D: A bright block
(Image number: N20140916T150900365ID30F22)
2.10 Surface Appearance and Cometary “Geology”
141