

distribution of textures on the nucleus surface appears to be very different. However,
the inferior resolution of the 19P/Borrelly data may be misleading (Thomas et al.
2013b).
By grouping similar terrain and looking at distinct topographic discontinuities, a
total of 25 regions have been classified on 67P (El-Maarry et al. 2015a, 2016, 2017a;
Thomas et al. 2018). The regions are shown in Fig. 2.50 where they have been
mapped back onto a 3D shape model of the nucleus. The number of distinct regions
on the surface is large and, as a result, the individual regions were given names to
allow easier reference to a particular area. The names and their characteristics are
given in Fig. 2.50 and Table 2.5.
By mapping the regional boundaries back onto the 3D shape of the nucleus, the
surface area of each region can be estimated. This is not an entirely straightforward
calculation (it is rather like determining the length of a coastline—it is longer if the
resolution is higher) but with a nucleus model comprising 12 million facets
(Preusker et al. 2017), the values are shown in Table 2.5. These numbers are useful
for comparative purposes. A roughness index is also included in the table to indicate
the comparative surface roughness of the regions (at 2–3 m resolution). A low index
indicates the dominance of smoother terrains (e.g. Hapi) while a high index
(e.g. Anhur) indicates significant metre-scale roughness (Thomas et al. 2018).
The most recent versions of the 3D reconstruction of the nucleus of 67P has
allowed further sub-division in 71 distinct (either morphological or topographical)
sub-regions. An example is shown in Fig. 2.51 where the Aker region (Ar) has been
split into four sub-regions (region c is not evident from this viewing geometry). On
the left is an image from the Rosetta camera, OSIRIS, and on the right is the
sub-region definition. Aker has three distinct faces that are topographically at
different orientations. At the bottom, the surface texture changes abruptly from the
smoother terrain of Aker b to the much rougher terrain of Anhur. The topographical
and morphological boundary between Bastet (Bs c) and the Hapi region (which
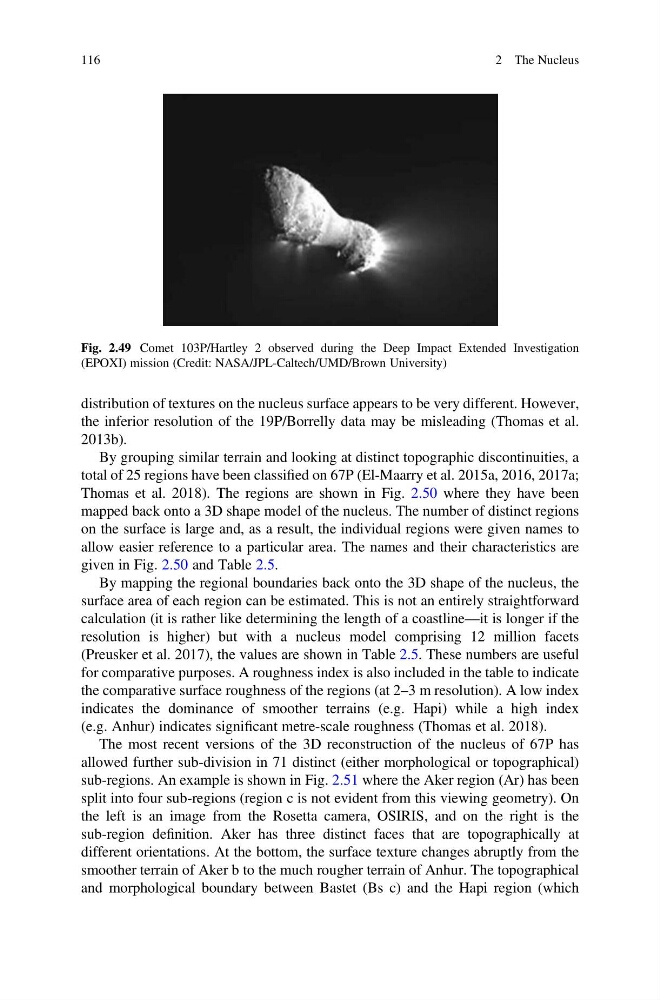
Fig. 2.49 Comet 103P/Hartley 2 observed during the Deep Impact Extended Investigation
(EPOXI) mission (Credit: NASA/JPL-Caltech/UMD/Brown University)
116
2 The Nucleus
the inferior resolution of the 19P/Borrelly data may be misleading (Thomas et al.
2013b).
By grouping similar terrain and looking at distinct topographic discontinuities, a
total of 25 regions have been classified on 67P (El-Maarry et al. 2015a, 2016, 2017a;
Thomas et al. 2018). The regions are shown in Fig. 2.50 where they have been
mapped back onto a 3D shape model of the nucleus. The number of distinct regions
on the surface is large and, as a result, the individual regions were given names to
allow easier reference to a particular area. The names and their characteristics are
given in Fig. 2.50 and Table 2.5.
By mapping the regional boundaries back onto the 3D shape of the nucleus, the
surface area of each region can be estimated. This is not an entirely straightforward
calculation (it is rather like determining the length of a coastline—it is longer if the
resolution is higher) but with a nucleus model comprising 12 million facets
(Preusker et al. 2017), the values are shown in Table 2.5. These numbers are useful
for comparative purposes. A roughness index is also included in the table to indicate
the comparative surface roughness of the regions (at 2–3 m resolution). A low index
indicates the dominance of smoother terrains (e.g. Hapi) while a high index
(e.g. Anhur) indicates significant metre-scale roughness (Thomas et al. 2018).
The most recent versions of the 3D reconstruction of the nucleus of 67P has
allowed further sub-division in 71 distinct (either morphological or topographical)
sub-regions. An example is shown in Fig. 2.51 where the Aker region (Ar) has been
split into four sub-regions (region c is not evident from this viewing geometry). On
the left is an image from the Rosetta camera, OSIRIS, and on the right is the
sub-region definition. Aker has three distinct faces that are topographically at
different orientations. At the bottom, the surface texture changes abruptly from the
smoother terrain of Aker b to the much rougher terrain of Anhur. The topographical
and morphological boundary between Bastet (Bs c) and the Hapi region (which
Fig. 2.49 Comet 103P/Hartley 2 observed during the Deep Impact Extended Investigation
(EPOXI) mission (Credit: NASA/JPL-Caltech/UMD/Brown University)
116
2 The Nucleus