

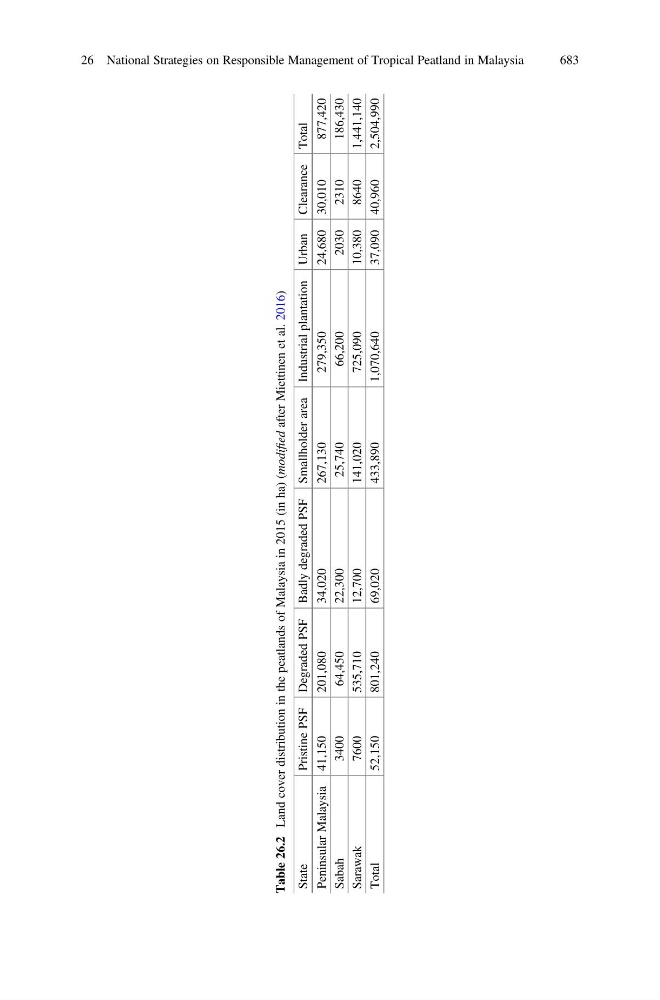
Table 26.2
Land cover distribution in the peatlands of Malaysia in 2015 (in ha) (modified after Miettinen et al. 2016)
State
Pristine PSF Degraded PSF Badly degraded PSF Smallholder area Industrial plantation Urban Clearance Total
Peninsular Malaysia 41,150
201,080
34,020
267,130
279,350
24,680 30,010
877,420
Sabah
3400
64,450
22,300
25,740
66,200
2030
2310
186,430
Sarawak
7600
535,710
12,700
141,020
725,090
10,380
8640
1,441,140
Total
52,150
801,240
69,020
433,890
1,070,640
37,090 40,960
2,504,990
26 National Strategies on Responsible Management of Tropical Peatland in Malaysia
683