

compacted by the heavy machinery. It has the PVC pipe of 30 cm to drain to the
downstream. Water does not exceed the top of the weir because of this drainpipe.
We conducted the measurement of the groundwater level and groundwater flow
for 6 points around the peat weir. The measurements were conducted on August
22, 2017. At first, we made borehole by a peat sampler up to 2 m and waited around
1 day for stabilization. The vertical distance from the ground surface to the groundwater surface was measured, and the groundwater surface elevation was measured
by GNSS for each point. Furthermore, the groundwater flow velocity was measured
using PDGV at the same point.
Measured groundwater level distribution is shown in Fig. 19.17. The water level
is 7.7 m at the upper reach (south area) of the Weir 3 and 7.3 m at the lower reach.
Therefore, the GWL difference was 0.4 m when the measurement was carried out at
Weir 3. The GWL contour is curved surrounding the weir. Judging from the
groundwater level contour, the groundwater is effectively stored but in the lower
reach of the weir, the groundwater tends to have high discharge because of the high
GWL gradient.
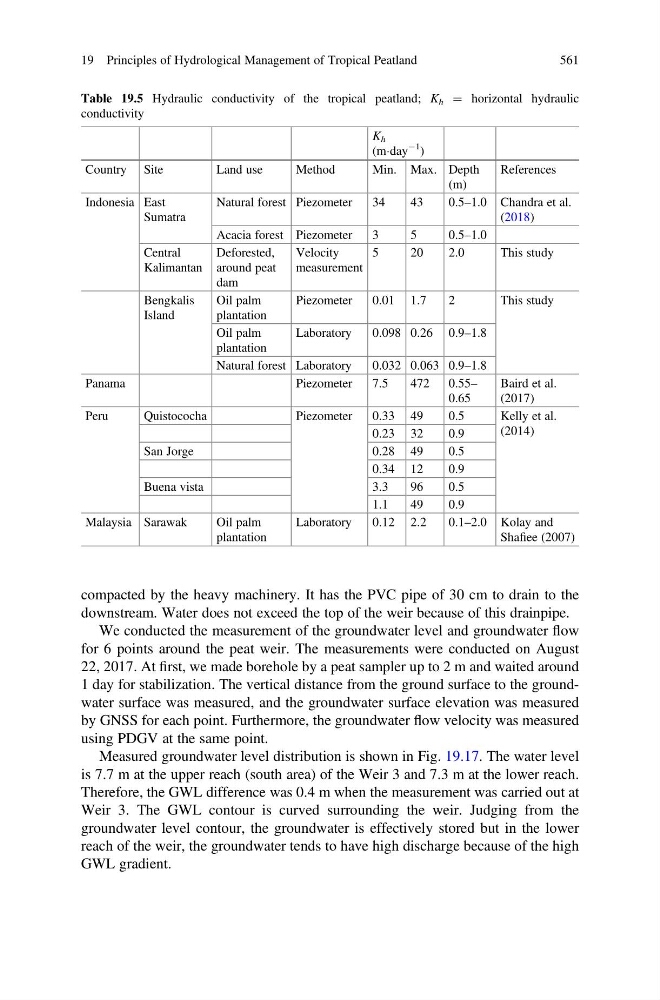
Table 19.5 Hydraulic conductivity of the tropical peatland; K h ¼ horizontal hydraulic
conductivity
K h
(mÁday
À1
)
Country Site
Land use
Method
Min. Max. Depth
(m)
References
Indonesia East
Sumatra
Natural forest Piezometer
34
43
0.5–1.0 Chandra et al.
(2018)
Acacia forest Piezometer
3
5
0.5–1.0
Central
Kalimantan
Deforested,
around peat
dam
Velocity
measurement
5
20
2.0
This study
Bengkalis
Island
Oil palm
plantation
Piezometer
0.01 1.7
2
This study
Oil palm
plantation
Laboratory
0.098 0.26 0.9–1.8
Natural forest Laboratory
0.032 0.063 0.9–1.8
Panama
Piezometer
7.5
472 0.55–
0.65
Baird et al.
(2017)
Peru
Quistococha
Piezometer
0.33 49
0.5
Kelly et al.
(2014)
0.23 32
0.9
San Jorge
0.28 49
0.5
0.34 12
0.9
Buena vista
3.3
96
0.5
1.1
49
0.9
Malaysia Sarawak
Oil palm
plantation
Laboratory
0.12 2.2
0.1–2.0 Kolay and
Shafiee (2007)
19 Principles of Hydrological Management of Tropical Peatland
561
downstream. Water does not exceed the top of the weir because of this drainpipe.
We conducted the measurement of the groundwater level and groundwater flow
for 6 points around the peat weir. The measurements were conducted on August
22, 2017. At first, we made borehole by a peat sampler up to 2 m and waited around
1 day for stabilization. The vertical distance from the ground surface to the groundwater surface was measured, and the groundwater surface elevation was measured
by GNSS for each point. Furthermore, the groundwater flow velocity was measured
using PDGV at the same point.
Measured groundwater level distribution is shown in Fig. 19.17. The water level
is 7.7 m at the upper reach (south area) of the Weir 3 and 7.3 m at the lower reach.
Therefore, the GWL difference was 0.4 m when the measurement was carried out at
Weir 3. The GWL contour is curved surrounding the weir. Judging from the
groundwater level contour, the groundwater is effectively stored but in the lower
reach of the weir, the groundwater tends to have high discharge because of the high
GWL gradient.
Table 19.5 Hydraulic conductivity of the tropical peatland; K h ¼ horizontal hydraulic
conductivity
K h
(mÁday
À1
)
Country Site
Land use
Method
Min. Max. Depth
(m)
References
Indonesia East
Sumatra
Natural forest Piezometer
34
43
0.5–1.0 Chandra et al.
(2018)
Acacia forest Piezometer
3
5
0.5–1.0
Central
Kalimantan
Deforested,
around peat
dam
Velocity
measurement
5
20
2.0
This study
Bengkalis
Island
Oil palm
plantation
Piezometer
0.01 1.7
2
This study
Oil palm
plantation
Laboratory
0.098 0.26 0.9–1.8
Natural forest Laboratory
0.032 0.063 0.9–1.8
Panama
Piezometer
7.5
472 0.55–
0.65
Baird et al.
(2017)
Peru
Quistococha
Piezometer
0.33 49
0.5
Kelly et al.
(2014)
0.23 32
0.9
San Jorge
0.28 49
0.5
0.34 12
0.9
Buena vista
3.3
96
0.5
1.1
49
0.9
Malaysia Sarawak
Oil palm
plantation
Laboratory
0.12 2.2
0.1–2.0 Kolay and
Shafiee (2007)
19 Principles of Hydrological Management of Tropical Peatland
561