

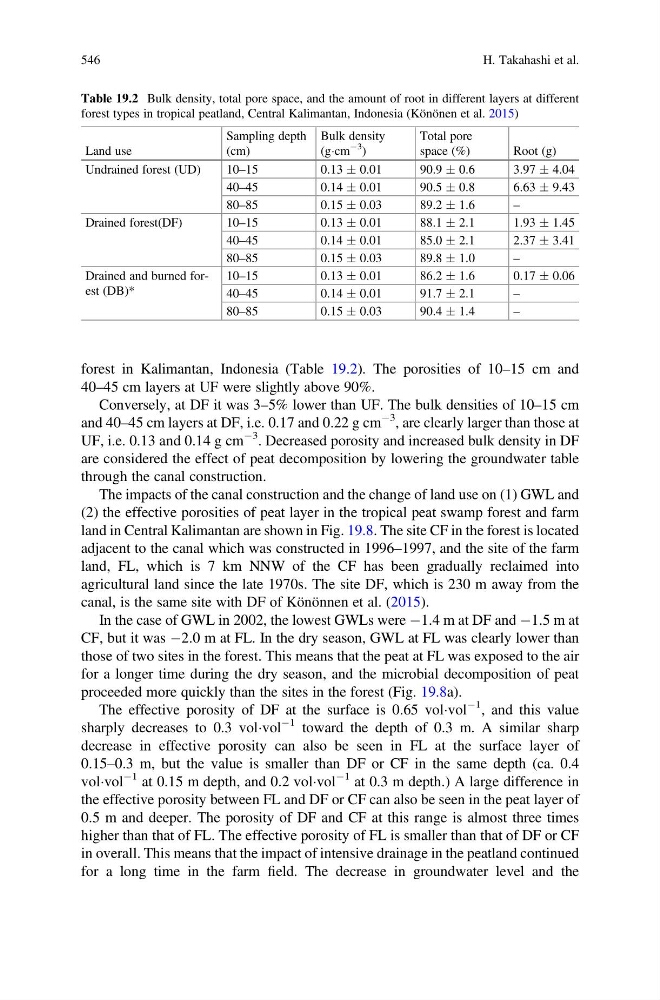
forest in Kalimantan, Indonesia (Table 19.2). The porosities of 10–15 cm and
40–45 cm layers at UF were slightly above 90%.
Conversely, at DF it was 3–5% lower than UF. The bulk densities of 10–15 cm
and 40–45 cm layers at DF, i.e. 0.17 and 0.22 g cm
À3 , are clearly larger than those at
UF, i.e. 0.13 and 0.14 g cm
À3 . Decreased porosity and increased bulk density in DF
are considered the effect of peat decomposition by lowering the groundwater table
through the canal construction.
The impacts of the canal construction and the change of land use on (1) GWL and
(2) the effective porosities of peat layer in the tropical peat swamp forest and farm
land in Central Kalimantan are shown in Fig. 19.8. The site CF in the forest is located
adjacent to the canal which was constructed in 1996–1997, and the site of the farm
land, FL, which is 7 km NNW of the CF has been gradually reclaimed into
agricultural land since the late 1970s. The site DF, which is 230 m away from the
canal, is the same site with DF of Könönnen et al. (2015).
In the case of GWL in 2002, the lowest GWLs were À1.4 m at DF and À1.5 m at
CF, but it was À2.0 m at FL. In the dry season, GWL at FL was clearly lower than
those of two sites in the forest. This means that the peat at FL was exposed to the air
for a longer time during the dry season, and the microbial decomposition of peat
proceeded more quickly than the sites in the forest (Fig. 19.8a).
The effective porosity of DF at the surface is 0.65 volÁvol
À1 , and this value
sharply decreases to 0.3 volÁvol
À1 toward the depth of 0.3 m. A similar sharp
decrease in effective porosity can also be seen in FL at the surface layer of
0.15–0.3 m, but the value is smaller than DF or CF in the same depth (ca. 0.4
volÁvol
À1 at 0.15 m depth, and 0.2 volÁvol
À1 at 0.3 m depth.) A large difference in
the effective porosity between FL and DF or CF can also be seen in the peat layer of
0.5 m and deeper. The porosity of DF and CF at this range is almost three times
higher than that of FL. The effective porosity of FL is smaller than that of DF or CF
in overall. This means that the impact of intensive drainage in the peatland continued
for a long time in the farm field. The decrease in groundwater level and the
Table 19.2 Bulk density, total pore space, and the amount of root in different layers at different
forest types in tropical peatland, Central Kalimantan, Indonesia (Könönen et al. 2015)
Land use
Sampling depth
(cm)
Bulk density
(gÁcm
À3
)
Total pore
space (%)
Root (g)
Undrained forest (UD)
10–15
0.13 Æ 0.01
90.9 Æ 0.6
3.97 Æ 4.04
40–45
0.14 Æ 0.01
90.5 Æ 0.8
6.63 Æ 9.43
80–85
0.15 Æ 0.03
89.2 Æ 1.6
–
Drained forest(DF)
10–15
0.13 Æ 0.01
88.1 Æ 2.1
1.93 Æ 1.45
40–45
0.14 Æ 0.01
85.0 Æ 2.1
2.37 Æ 3.41
80–85
0.15 Æ 0.03
89.8 Æ 1.0
–
Drained and burned forest (DB)*
10–15
0.13 Æ 0.01
86.2 Æ 1.6
0.17 Æ 0.06
40–45
0.14 Æ 0.01
91.7 Æ 2.1
–
80–85
0.15 Æ 0.03
90.4 Æ 1.4
–
546
H. Takahashi et al.
40–45 cm layers at UF were slightly above 90%.
Conversely, at DF it was 3–5% lower than UF. The bulk densities of 10–15 cm
and 40–45 cm layers at DF, i.e. 0.17 and 0.22 g cm
À3 , are clearly larger than those at
UF, i.e. 0.13 and 0.14 g cm
À3 . Decreased porosity and increased bulk density in DF
are considered the effect of peat decomposition by lowering the groundwater table
through the canal construction.
The impacts of the canal construction and the change of land use on (1) GWL and
(2) the effective porosities of peat layer in the tropical peat swamp forest and farm
land in Central Kalimantan are shown in Fig. 19.8. The site CF in the forest is located
adjacent to the canal which was constructed in 1996–1997, and the site of the farm
land, FL, which is 7 km NNW of the CF has been gradually reclaimed into
agricultural land since the late 1970s. The site DF, which is 230 m away from the
canal, is the same site with DF of Könönnen et al. (2015).
In the case of GWL in 2002, the lowest GWLs were À1.4 m at DF and À1.5 m at
CF, but it was À2.0 m at FL. In the dry season, GWL at FL was clearly lower than
those of two sites in the forest. This means that the peat at FL was exposed to the air
for a longer time during the dry season, and the microbial decomposition of peat
proceeded more quickly than the sites in the forest (Fig. 19.8a).
The effective porosity of DF at the surface is 0.65 volÁvol
À1 , and this value
sharply decreases to 0.3 volÁvol
À1 toward the depth of 0.3 m. A similar sharp
decrease in effective porosity can also be seen in FL at the surface layer of
0.15–0.3 m, but the value is smaller than DF or CF in the same depth (ca. 0.4
volÁvol
À1 at 0.15 m depth, and 0.2 volÁvol
À1 at 0.3 m depth.) A large difference in
the effective porosity between FL and DF or CF can also be seen in the peat layer of
0.5 m and deeper. The porosity of DF and CF at this range is almost three times
higher than that of FL. The effective porosity of FL is smaller than that of DF or CF
in overall. This means that the impact of intensive drainage in the peatland continued
for a long time in the farm field. The decrease in groundwater level and the
Table 19.2 Bulk density, total pore space, and the amount of root in different layers at different
forest types in tropical peatland, Central Kalimantan, Indonesia (Könönen et al. 2015)
Land use
Sampling depth
(cm)
Bulk density
(gÁcm
À3
)
Total pore
space (%)
Root (g)
Undrained forest (UD)
10–15
0.13 Æ 0.01
90.9 Æ 0.6
3.97 Æ 4.04
40–45
0.14 Æ 0.01
90.5 Æ 0.8
6.63 Æ 9.43
80–85
0.15 Æ 0.03
89.2 Æ 1.6
–
Drained forest(DF)
10–15
0.13 Æ 0.01
88.1 Æ 2.1
1.93 Æ 1.45
40–45
0.14 Æ 0.01
85.0 Æ 2.1
2.37 Æ 3.41
80–85
0.15 Æ 0.03
89.8 Æ 1.0
–
Drained and burned forest (DB)*
10–15
0.13 Æ 0.01
86.2 Æ 1.6
0.17 Æ 0.06
40–45
0.14 Æ 0.01
91.7 Æ 2.1
–
80–85
0.15 Æ 0.03
90.4 Æ 1.4
–
546
H. Takahashi et al.