

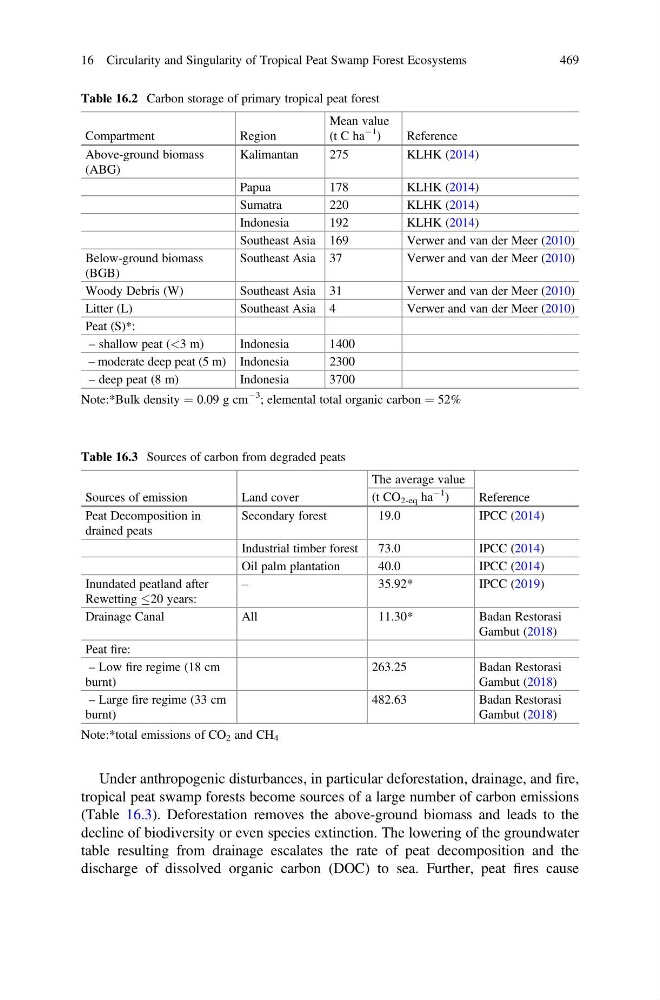
Under anthropogenic disturbances, in particular deforestation, drainage, and fire,
tropical peat swamp forests become sources of a large number of carbon emissions
(Table 16.3). Deforestation removes the above-ground biomass and leads to the
decline of biodiversity or even species extinction. The lowering of the groundwater
table resulting from drainage escalates the rate of peat decomposition and the
discharge of dissolved organic carbon (DOC) to sea. Further, peat fires cause
Table 16.2 Carbon storage of primary tropical peat forest
Compartment
Region
Mean value
(t C ha
À1
)
Reference
Above-ground biomass
(ABG)
Kalimantan
275
KLHK (2014)
Papua
178
KLHK (2014)
Sumatra
220
KLHK (2014)
Indonesia
192
KLHK (2014)
Southeast Asia 169
Verwer and van der Meer (2010)
Below-ground biomass
(BGB)
Southeast Asia 37
Verwer and van der Meer (2010)
Woody Debris (W)
Southeast Asia 31
Verwer and van der Meer (2010)
Litter (L)
Southeast Asia 4
Verwer and van der Meer (2010)
Peat (S)*:
– shallow peat (<3 m)
Indonesia
1400
– moderate deep peat (5 m) Indonesia
2300
– deep peat (8 m)
Indonesia
3700
Note:*Bulk density ¼ 0.09 g cm
À3
; elemental total organic carbon ¼ 52%
Table 16.3 Sources of carbon from degraded peats
Sources of emission
Land cover
The average value
Reference
(t CO 2-eq ha
À1
)
Peat Decomposition in
drained peats
Secondary forest
19.0
IPCC (2014)
Industrial timber forest
73.0
IPCC (2014)
Oil palm plantation
40.0
IPCC (2014)
Inundated peatland after
Rewetting 20 years:
–
35.92*
IPCC (2019)
Drainage Canal
All
11.30*
Badan Restorasi
Gambut (2018)
Peat fire:
– Low fire regime (18 cm
burnt)
263.25
Badan Restorasi
Gambut (2018)
– Large fire regime (33 cm
burnt)
482.63
Badan Restorasi
Gambut (2018)
Note:*total emissions of CO 2 and CH 4
16 Circularity and Singularity of Tropical Peat Swamp Forest Ecosystems
469
tropical peat swamp forests become sources of a large number of carbon emissions
(Table 16.3). Deforestation removes the above-ground biomass and leads to the
decline of biodiversity or even species extinction. The lowering of the groundwater
table resulting from drainage escalates the rate of peat decomposition and the
discharge of dissolved organic carbon (DOC) to sea. Further, peat fires cause
Table 16.2 Carbon storage of primary tropical peat forest
Compartment
Region
Mean value
(t C ha
À1
)
Reference
Above-ground biomass
(ABG)
Kalimantan
275
KLHK (2014)
Papua
178
KLHK (2014)
Sumatra
220
KLHK (2014)
Indonesia
192
KLHK (2014)
Southeast Asia 169
Verwer and van der Meer (2010)
Below-ground biomass
(BGB)
Southeast Asia 37
Verwer and van der Meer (2010)
Woody Debris (W)
Southeast Asia 31
Verwer and van der Meer (2010)
Litter (L)
Southeast Asia 4
Verwer and van der Meer (2010)
Peat (S)*:
– shallow peat (<3 m)
Indonesia
1400
– moderate deep peat (5 m) Indonesia
2300
– deep peat (8 m)
Indonesia
3700
Note:*Bulk density ¼ 0.09 g cm
À3
; elemental total organic carbon ¼ 52%
Table 16.3 Sources of carbon from degraded peats
Sources of emission
Land cover
The average value
Reference
(t CO 2-eq ha
À1
)
Peat Decomposition in
drained peats
Secondary forest
19.0
IPCC (2014)
Industrial timber forest
73.0
IPCC (2014)
Oil palm plantation
40.0
IPCC (2014)
Inundated peatland after
Rewetting 20 years:
–
35.92*
IPCC (2019)
Drainage Canal
All
11.30*
Badan Restorasi
Gambut (2018)
Peat fire:
– Low fire regime (18 cm
burnt)
263.25
Badan Restorasi
Gambut (2018)
– Large fire regime (33 cm
burnt)
482.63
Badan Restorasi
Gambut (2018)
Note:*total emissions of CO 2 and CH 4
16 Circularity and Singularity of Tropical Peat Swamp Forest Ecosystems
469