

will be impacted by the canal blocking establishment is very important to avoid
conflict in the future.
Furthermore, the effect of dam establishment in the ditches to their surrounding
area is also monitored, but it is too early to conclude that the dams have raised the
water table. However, our preliminary finding from the manual measurement using
dipwell (PVC) located at 15 m, 30 m, and 45 m from the dams in both sides (left and
right sides) showed that the water table raised around 10 cm at the dipwell located
15 m from the dam (see Table 13.5).
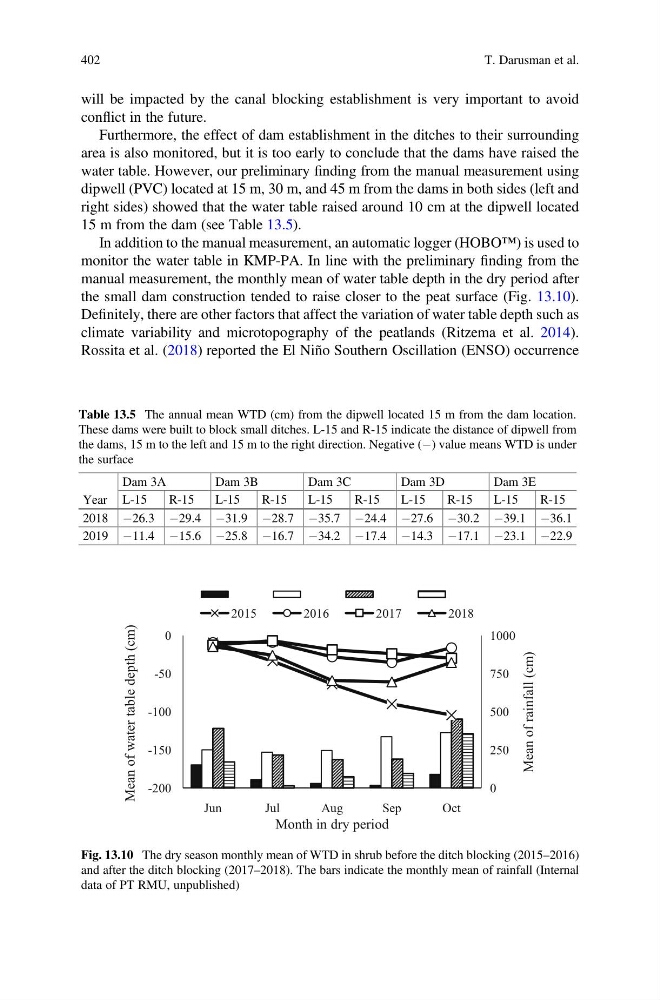
In addition to the manual measurement, an automatic logger (HOBO™) is used to
monitor the water table in KMP-PA. In line with the preliminary finding from the
manual measurement, the monthly mean of water table depth in the dry period after
the small dam construction tended to raise closer to the peat surface (Fig. 13.10).
Definitely, there are other factors that affect the variation of water table depth such as
climate variability and microtopography of the peatlands (Ritzema et al. 2014).
Rossita et al. (2018) reported the El Niño Southern Oscillation (ENSO) occurrence
Table 13.5 The annual mean WTD (cm) from the dipwell located 15 m from the dam location.
These dams were built to block small ditches. L-15 and R-15 indicate the distance of dipwell from
the dams, 15 m to the left and 15 m to the right direction. Negative (À) value means WTD is under
the surface
Year
Dam 3A
Dam 3B
Dam 3C
Dam 3D
Dam 3E
L-15
R-15
L-15
R-15
L-15
R-15
L-15
R-15
L-15
R-15
2018 À26.3 À29.4 À31.9 À28.7 À35.7 À24.4 À27.6 À30.2 À39.1 À36.1
2019 À11.4 À15.6 À25.8 À16.7 À34.2 À17.4 À14.3 À17.1 À23.1 À22.9
0
250
500
750
1000
-200
-150
-100
-50
0
Jun
Jul
Aug
Sep
Oct
Mean of rainfall (cm)
Mean of water table depth (cm)
Month in dry period
2015
2016
2017
2018
Fig. 13.10 The dry season monthly mean of WTD in shrub before the ditch blocking (2015–2016)
and after the ditch blocking (2017–2018). The bars indicate the monthly mean of rainfall (Internal
data of PT RMU, unpublished)
402
T. Darusman et al.
conflict in the future.
Furthermore, the effect of dam establishment in the ditches to their surrounding
area is also monitored, but it is too early to conclude that the dams have raised the
water table. However, our preliminary finding from the manual measurement using
dipwell (PVC) located at 15 m, 30 m, and 45 m from the dams in both sides (left and
right sides) showed that the water table raised around 10 cm at the dipwell located
15 m from the dam (see Table 13.5).
In addition to the manual measurement, an automatic logger (HOBO™) is used to
monitor the water table in KMP-PA. In line with the preliminary finding from the
manual measurement, the monthly mean of water table depth in the dry period after
the small dam construction tended to raise closer to the peat surface (Fig. 13.10).
Definitely, there are other factors that affect the variation of water table depth such as
climate variability and microtopography of the peatlands (Ritzema et al. 2014).
Rossita et al. (2018) reported the El Niño Southern Oscillation (ENSO) occurrence
Table 13.5 The annual mean WTD (cm) from the dipwell located 15 m from the dam location.
These dams were built to block small ditches. L-15 and R-15 indicate the distance of dipwell from
the dams, 15 m to the left and 15 m to the right direction. Negative (À) value means WTD is under
the surface
Year
Dam 3A
Dam 3B
Dam 3C
Dam 3D
Dam 3E
L-15
R-15
L-15
R-15
L-15
R-15
L-15
R-15
L-15
R-15
2018 À26.3 À29.4 À31.9 À28.7 À35.7 À24.4 À27.6 À30.2 À39.1 À36.1
2019 À11.4 À15.6 À25.8 À16.7 À34.2 À17.4 À14.3 À17.1 À23.1 À22.9
0
250
500
750
1000
-200
-150
-100
-50
0
Jun
Jul
Aug
Sep
Oct
Mean of rainfall (cm)
Mean of water table depth (cm)
Month in dry period
2015
2016
2017
2018
Fig. 13.10 The dry season monthly mean of WTD in shrub before the ditch blocking (2015–2016)
and after the ditch blocking (2017–2018). The bars indicate the monthly mean of rainfall (Internal
data of PT RMU, unpublished)
402
T. Darusman et al.