

temperature and processing time (Uzun et al. 2006). Different characteristics of
biochar result in different effects on soil and plant. This paper discusses the role of
biochar in improving suboptimal land quality including the physical, chemical, and
biological properties of the soil, land productivity, and its role in conserving soil
carbon.
11.2 Suboptimal Land in Indonesia
Suboptimal land is the land that naturally has poor productivity due to the internal
and external factors (Mulyani and Sarwani 2013). The mainland area of Indonesia is
189.1 million ha, mostly consisting of suboptimal land, where the widest area is
occupied with acid upland with wet climate (>2000 mm rainfall per year) and dry
climate (<2000 mm rainfall per year). Suboptimal land is grouped into four land
typologies, namely acid upland, semi-arid, tidal swampland, and freshwater
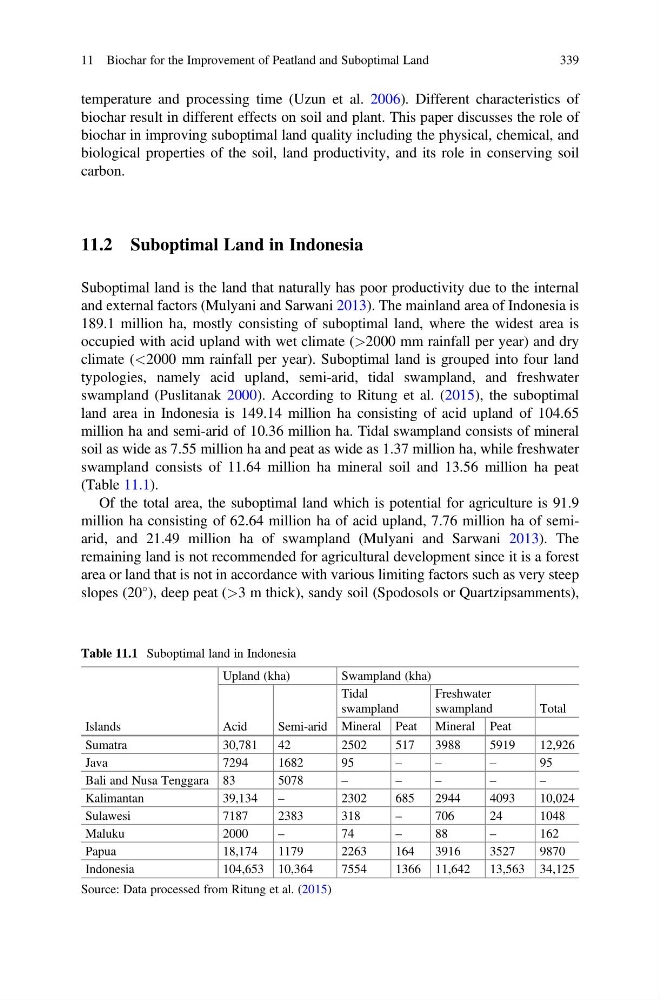
swampland (Puslitanak 2000). According to Ritung et al. (2015), the suboptimal
land area in Indonesia is 149.14 million ha consisting of acid upland of 104.65
million ha and semi-arid of 10.36 million ha. Tidal swampland consists of mineral
soil as wide as 7.55 million ha and peat as wide as 1.37 million ha, while freshwater
swampland consists of 11.64 million ha mineral soil and 13.56 million ha peat
(Table 11.1).
Of the total area, the suboptimal land which is potential for agriculture is 91.9
million ha consisting of 62.64 million ha of acid upland, 7.76 million ha of semiarid, and 21.49 million ha of swampland (Mulyani and Sarwani 2013). The
remaining land is not recommended for agricultural development since it is a forest
area or land that is not in accordance with various limiting factors such as very steep
slopes (20
), deep peat (>3 m thick), sandy soil (Spodosols or Quartzipsamments),
Table 11.1 Suboptimal land in Indonesia
Islands
Upland (kha)
Swampland (kha)
Acid
Semi-arid
Tidal
swampland
Freshwater
swampland
Total
Mineral Peat Mineral Peat
Sumatra
30,781
42
2502
517
3988
5919
12,926
Java
7294
1682
95
–
–
–
95
Bali and Nusa Tenggara 83
5078
–
–
–
–
–
Kalimantan
39,134
–
2302
685
2944
4093
10,024
Sulawesi
7187
2383
318
–
706
24
1048
Maluku
2000
–
74
–
88
–
162
Papua
18,174
1179
2263
164
3916
3527
9870
Indonesia
104,653 10,364
7554
1366 11,642
13,563 34,125
Source: Data processed from Ritung et al. (2015)
11 Biochar for the Improvement of Peatland and Suboptimal Land
339
biochar result in different effects on soil and plant. This paper discusses the role of
biochar in improving suboptimal land quality including the physical, chemical, and
biological properties of the soil, land productivity, and its role in conserving soil
carbon.
11.2 Suboptimal Land in Indonesia
Suboptimal land is the land that naturally has poor productivity due to the internal
and external factors (Mulyani and Sarwani 2013). The mainland area of Indonesia is
189.1 million ha, mostly consisting of suboptimal land, where the widest area is
occupied with acid upland with wet climate (>2000 mm rainfall per year) and dry
climate (<2000 mm rainfall per year). Suboptimal land is grouped into four land
typologies, namely acid upland, semi-arid, tidal swampland, and freshwater
swampland (Puslitanak 2000). According to Ritung et al. (2015), the suboptimal
land area in Indonesia is 149.14 million ha consisting of acid upland of 104.65
million ha and semi-arid of 10.36 million ha. Tidal swampland consists of mineral
soil as wide as 7.55 million ha and peat as wide as 1.37 million ha, while freshwater
swampland consists of 11.64 million ha mineral soil and 13.56 million ha peat
(Table 11.1).
Of the total area, the suboptimal land which is potential for agriculture is 91.9
million ha consisting of 62.64 million ha of acid upland, 7.76 million ha of semiarid, and 21.49 million ha of swampland (Mulyani and Sarwani 2013). The
remaining land is not recommended for agricultural development since it is a forest
area or land that is not in accordance with various limiting factors such as very steep
slopes (20
), deep peat (>3 m thick), sandy soil (Spodosols or Quartzipsamments),
Table 11.1 Suboptimal land in Indonesia
Islands
Upland (kha)
Swampland (kha)
Acid
Semi-arid
Tidal
swampland
Freshwater
swampland
Total
Mineral Peat Mineral Peat
Sumatra
30,781
42
2502
517
3988
5919
12,926
Java
7294
1682
95
–
–
–
95
Bali and Nusa Tenggara 83
5078
–
–
–
–
–
Kalimantan
39,134
–
2302
685
2944
4093
10,024
Sulawesi
7187
2383
318
–
706
24
1048
Maluku
2000
–
74
–
88
–
162
Papua
18,174
1179
2263
164
3916
3527
9870
Indonesia
104,653 10,364
7554
1366 11,642
13,563 34,125
Source: Data processed from Ritung et al. (2015)
11 Biochar for the Improvement of Peatland and Suboptimal Land
339