

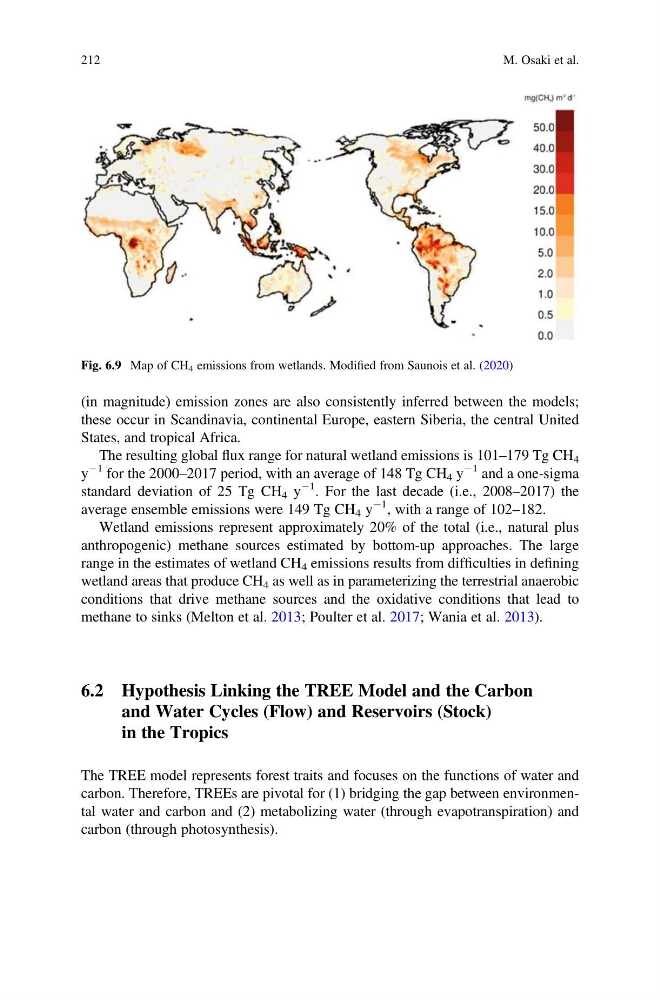
(in magnitude) emission zones are also consistently inferred between the models;
these occur in Scandinavia, continental Europe, eastern Siberia, the central United
States, and tropical Africa.
The resulting global flux range for natural wetland emissions is 101–179 Tg CH 4
y
À1 for the 2000–2017 period, with an average of 148 Tg CH 4 y
À1 and a one-sigma
standard deviation of 25 Tg CH 4 y
À1 . For the last decade (i.e., 2008–2017) the
average ensemble emissions were 149 Tg CH 4 y
À1 , with a range of 102–182.
Wetland emissions represent approximately 20% of the total (i.e., natural plus
anthropogenic) methane sources estimated by bottom-up approaches. The large
range in the estimates of wetland CH 4 emissions results from difficulties in defining
wetland areas that produce CH 4 as well as in parameterizing the terrestrial anaerobic
conditions that drive methane sources and the oxidative conditions that lead to
methane to sinks (Melton et al. 2013; Poulter et al. 2017; Wania et al. 2013).
6.2 Hypothesis Linking the TREE Model and the Carbon
and Water Cycles (Flow) and Reservoirs (Stock)
in the Tropics
The TREE model represents forest traits and focuses on the functions of water and
carbon. Therefore, TREEs are pivotal for (1) bridging the gap between environmental water and carbon and (2) metabolizing water (through evapotranspiration) and
carbon (through photosynthesis).
Fig. 6.9 Map of CH 4 emissions from wetlands. Modified from Saunois et al. (2020)
212
M. Osaki et al.
these occur in Scandinavia, continental Europe, eastern Siberia, the central United
States, and tropical Africa.
The resulting global flux range for natural wetland emissions is 101–179 Tg CH 4
y
À1 for the 2000–2017 period, with an average of 148 Tg CH 4 y
À1 and a one-sigma
standard deviation of 25 Tg CH 4 y
À1 . For the last decade (i.e., 2008–2017) the
average ensemble emissions were 149 Tg CH 4 y
À1 , with a range of 102–182.
Wetland emissions represent approximately 20% of the total (i.e., natural plus
anthropogenic) methane sources estimated by bottom-up approaches. The large
range in the estimates of wetland CH 4 emissions results from difficulties in defining
wetland areas that produce CH 4 as well as in parameterizing the terrestrial anaerobic
conditions that drive methane sources and the oxidative conditions that lead to
methane to sinks (Melton et al. 2013; Poulter et al. 2017; Wania et al. 2013).
6.2 Hypothesis Linking the TREE Model and the Carbon
and Water Cycles (Flow) and Reservoirs (Stock)
in the Tropics
The TREE model represents forest traits and focuses on the functions of water and
carbon. Therefore, TREEs are pivotal for (1) bridging the gap between environmental water and carbon and (2) metabolizing water (through evapotranspiration) and
carbon (through photosynthesis).
Fig. 6.9 Map of CH 4 emissions from wetlands. Modified from Saunois et al. (2020)
212
M. Osaki et al.