

would be between 2 and 3 Gt C year
À 1 , which would effectively offset 20–35% of
the global anthropogenic GHG emissions. As a strategy for climate change mitigation, soil carbon sequestration would help to delay the onset of negative consequences over the next 10–20 years, while other effective sequestration and
low-carbon technologies become viable.
There are reports of SOC increases in some parts of the world due to improved
management (e.g., Chen et al. 2015); however, a study on the global C stock showed
that some cropland areas have SOC contents that are below critical limits
(Stockmann et al. 2015). The best strategy is to restore the SOC content in these
degraded areas, as this would offset greenhouse gas emissions and provide the
benefit of enhanced soil conditions (Minasny et al. 2017).
6.1.2.4 Map of Global Peatland Distribution
Our knowledge of peatlands is vague—estimates of the global peatland extent range
from 1 to 4.6 million km
2
, and C stock estimates vary between 113 and 612 Pg
(or billion t C). Many studies have delineated peatland extents using land cover
derived from remote sensing images and ecological and environmental field surveys;
however, these studies have rarely performed validations or calculated the uncertainty of their predictions.
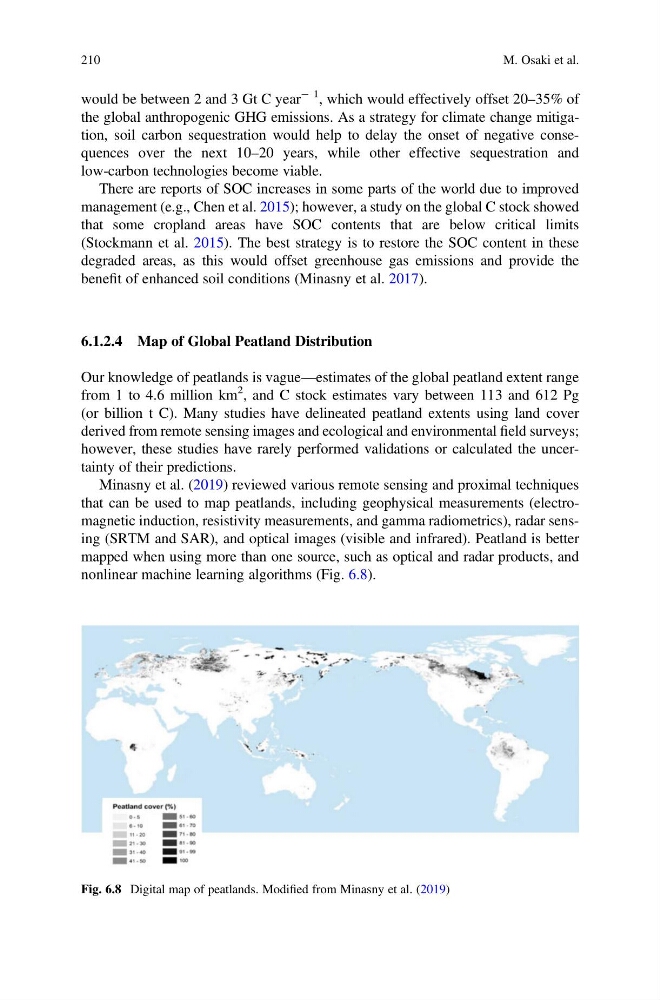
Minasny et al. (2019) reviewed various remote sensing and proximal techniques
that can be used to map peatlands, including geophysical measurements (electromagnetic induction, resistivity measurements, and gamma radiometrics), radar sensing (SRTM and SAR), and optical images (visible and infrared). Peatland is better
mapped when using more than one source, such as optical and radar products, and
nonlinear machine learning algorithms (Fig. 6.8).
Fig. 6.8 Digital map of peatlands. Modified from Minasny et al. (2019)
210
M. Osaki et al.
À 1 , which would effectively offset 20–35% of
the global anthropogenic GHG emissions. As a strategy for climate change mitigation, soil carbon sequestration would help to delay the onset of negative consequences over the next 10–20 years, while other effective sequestration and
low-carbon technologies become viable.
There are reports of SOC increases in some parts of the world due to improved
management (e.g., Chen et al. 2015); however, a study on the global C stock showed
that some cropland areas have SOC contents that are below critical limits
(Stockmann et al. 2015). The best strategy is to restore the SOC content in these
degraded areas, as this would offset greenhouse gas emissions and provide the
benefit of enhanced soil conditions (Minasny et al. 2017).
6.1.2.4 Map of Global Peatland Distribution
Our knowledge of peatlands is vague—estimates of the global peatland extent range
from 1 to 4.6 million km
2
, and C stock estimates vary between 113 and 612 Pg
(or billion t C). Many studies have delineated peatland extents using land cover
derived from remote sensing images and ecological and environmental field surveys;
however, these studies have rarely performed validations or calculated the uncertainty of their predictions.
Minasny et al. (2019) reviewed various remote sensing and proximal techniques
that can be used to map peatlands, including geophysical measurements (electromagnetic induction, resistivity measurements, and gamma radiometrics), radar sensing (SRTM and SAR), and optical images (visible and infrared). Peatland is better
mapped when using more than one source, such as optical and radar products, and
nonlinear machine learning algorithms (Fig. 6.8).
Fig. 6.8 Digital map of peatlands. Modified from Minasny et al. (2019)
210
M. Osaki et al.