

world’s forests are in only five countries—the Russian Federation, Brazil, Canada,
the United States of America, and China.
Sullivan et al. (2020) analyzed data from 590 permanent plots located across the
tropics in South American, African, Asian, and Australian tropical lowland forests
(273, 239, 61, and 17 plots, respectively). In these regions, maximum temperature is
the most important predictor of aboveground biomass (À9.1 mega grams of carbon
per hectare per degree Celsius), primarily due to its role in reducing woody productivity, and has a greater impact per
C in the hottest forests (>32.2
C). To better
assess the dynamic controls on aboveground carbon stocks, these authors also
computed the rate of carbon gained by systems (i.e., the aboveground woody carbon
production, calculated as tree growth plus newly recruited trees in Mg C ha
À1 year
À1 )
and the carbon residence time in living biomass (calculated as the ratio of living
carbon stocks to carbon gains, in years). They found considerable variation in the
biomass of carbon among the continents, with lower stocks per unit area in South
America than in the paleotropics, even after accounting for environmental variables.
Continents with high carbon stocks had either large carbon gains (Asia) or long
carbon residence times (Africa) because of the differences among the continents,
which are potentially due to differences in evolutionary history (Slik et al. 2018).
Slik et al. (2018) identified five principal floristic regions and their floristic relationships: (1) Indo-Pacific, (2) subtropical, (3) African, (4) American, and (5) dry forests.
Woody productivity (i.e., carbon stock) in the tropics is different among continents; the reasons for this difference include temperature and phylogenetic evolutionary history. Given that solar radiation is similar among the continents, it is
interesting to consider why different temperatures and levels of dryness occur. It is
hypothesized that the water cycle is also essential to tropical ecosystems. This cycle
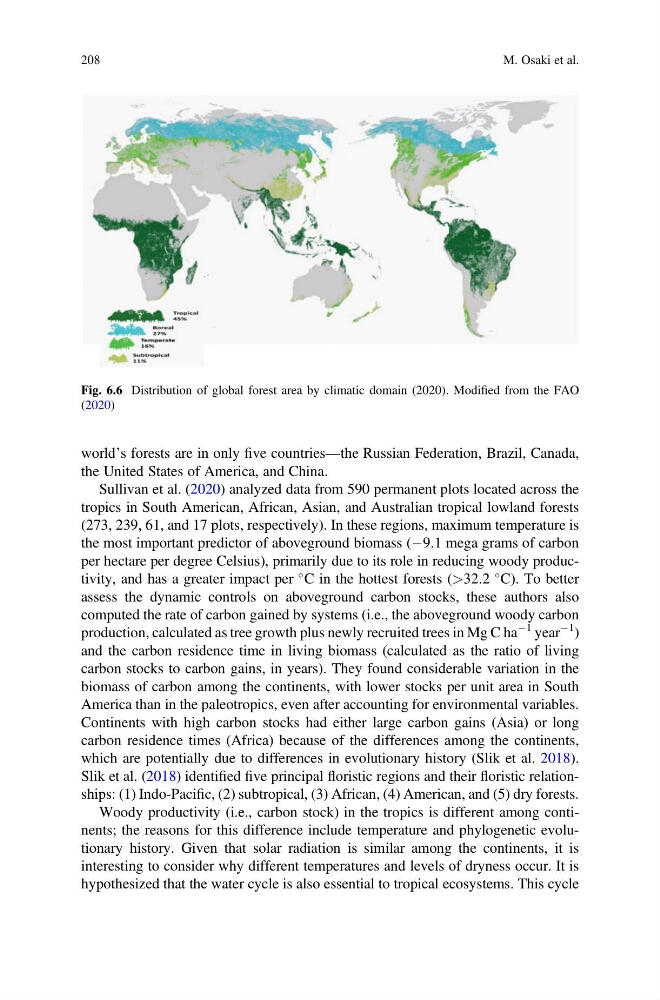
Fig. 6.6 Distribution of global forest area by climatic domain (2020). Modified from the FAO
(2020)
208
M. Osaki et al.
the United States of America, and China.
Sullivan et al. (2020) analyzed data from 590 permanent plots located across the
tropics in South American, African, Asian, and Australian tropical lowland forests
(273, 239, 61, and 17 plots, respectively). In these regions, maximum temperature is
the most important predictor of aboveground biomass (À9.1 mega grams of carbon
per hectare per degree Celsius), primarily due to its role in reducing woody productivity, and has a greater impact per
C in the hottest forests (>32.2
C). To better
assess the dynamic controls on aboveground carbon stocks, these authors also
computed the rate of carbon gained by systems (i.e., the aboveground woody carbon
production, calculated as tree growth plus newly recruited trees in Mg C ha
À1 year
À1 )
and the carbon residence time in living biomass (calculated as the ratio of living
carbon stocks to carbon gains, in years). They found considerable variation in the
biomass of carbon among the continents, with lower stocks per unit area in South
America than in the paleotropics, even after accounting for environmental variables.
Continents with high carbon stocks had either large carbon gains (Asia) or long
carbon residence times (Africa) because of the differences among the continents,
which are potentially due to differences in evolutionary history (Slik et al. 2018).
Slik et al. (2018) identified five principal floristic regions and their floristic relationships: (1) Indo-Pacific, (2) subtropical, (3) African, (4) American, and (5) dry forests.
Woody productivity (i.e., carbon stock) in the tropics is different among continents; the reasons for this difference include temperature and phylogenetic evolutionary history. Given that solar radiation is similar among the continents, it is
interesting to consider why different temperatures and levels of dryness occur. It is
hypothesized that the water cycle is also essential to tropical ecosystems. This cycle
Fig. 6.6 Distribution of global forest area by climatic domain (2020). Modified from the FAO
(2020)
208
M. Osaki et al.