

images of PALSAR/PALSAR2. Peat samples were collected to measure the peat
depth, carbon content, and bulk density for 16 drill holes in the San Martin
Department of the Peruvian Amazon.
Optical Sensor (Landsat-8 and Sentinel-2)
Because aguaje has a higher spectral reflectance in the VNIR bands and a lower
spectral reflectance in the SWIR bands of Landsat-8 and Sentinel-2, aguaje is
discriminated from mixed wetland forest, upland forest, grass, and rice (Fig. 5.12).
Microwave Sensor (L-band PALSAR and PALSAR2)
Polarization of L-band HH (horizontal transmitting, horizontal receiving) microwave radiation is effective for wetland forest mapping (Hess et al. 2003). The
backscattered signal of PALSAR and PALSAR-2 (L-bands) is increased in the
flooded forest because of the double bounce interactions as a mirror effect generated
at the water surface and tree trunks of the wetland forest, especially aguaje, with
more than À6 dB in the peatland in the San Martin Department in general (Fig. 5.13).
As a result, aguaje peatland was discriminated from previous wetland forest areas
in the San Martin Department by satellite image analysis and verified by field
surveys. A set of peat samples were collected, and 100–360 cm thicknesses of
tropical peatlands were discovered, which is unprecedented in the highland Amazon
(Fig. 5.14).
The combination of optical sensors with L-band PALSAR/PALSAR-2 is effective for mapping the “aguaje dominated peatlands” in the San Martin Department of
the Peruvian Amazon. The aguaje peatland map supplies fundamental information to
the forest zoning map, fragile ecosystem zone map, water resource map, and others.
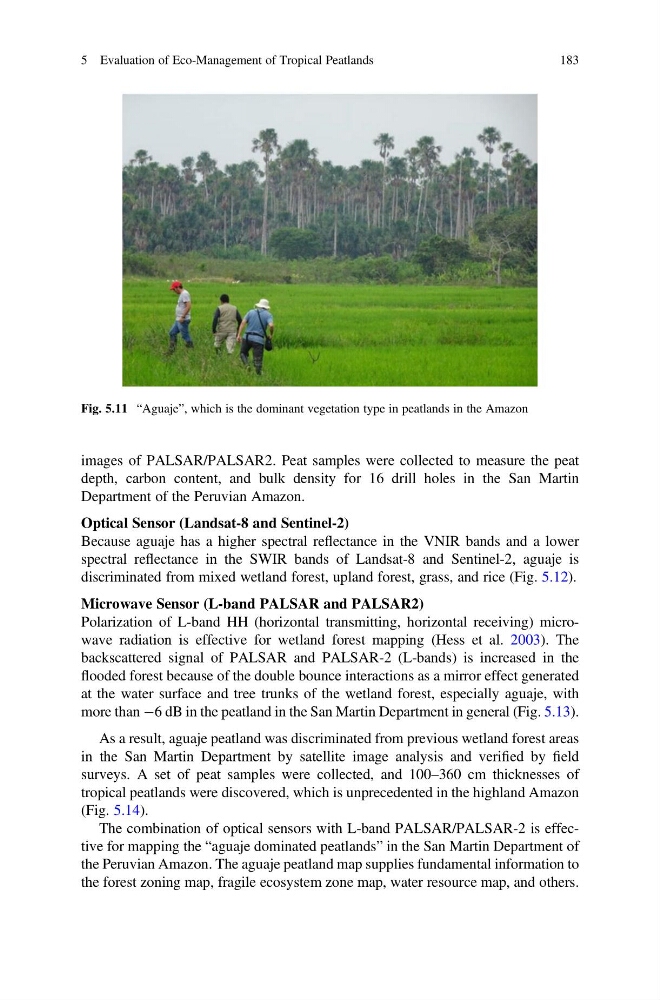
Fig. 5.11 “Aguaje”, which is the dominant vegetation type in peatlands in the Amazon
5 Evaluation of Eco-Management of Tropical Peatlands
183
depth, carbon content, and bulk density for 16 drill holes in the San Martin
Department of the Peruvian Amazon.
Optical Sensor (Landsat-8 and Sentinel-2)
Because aguaje has a higher spectral reflectance in the VNIR bands and a lower
spectral reflectance in the SWIR bands of Landsat-8 and Sentinel-2, aguaje is
discriminated from mixed wetland forest, upland forest, grass, and rice (Fig. 5.12).
Microwave Sensor (L-band PALSAR and PALSAR2)
Polarization of L-band HH (horizontal transmitting, horizontal receiving) microwave radiation is effective for wetland forest mapping (Hess et al. 2003). The
backscattered signal of PALSAR and PALSAR-2 (L-bands) is increased in the
flooded forest because of the double bounce interactions as a mirror effect generated
at the water surface and tree trunks of the wetland forest, especially aguaje, with
more than À6 dB in the peatland in the San Martin Department in general (Fig. 5.13).
As a result, aguaje peatland was discriminated from previous wetland forest areas
in the San Martin Department by satellite image analysis and verified by field
surveys. A set of peat samples were collected, and 100–360 cm thicknesses of
tropical peatlands were discovered, which is unprecedented in the highland Amazon
(Fig. 5.14).
The combination of optical sensors with L-band PALSAR/PALSAR-2 is effective for mapping the “aguaje dominated peatlands” in the San Martin Department of
the Peruvian Amazon. The aguaje peatland map supplies fundamental information to
the forest zoning map, fragile ecosystem zone map, water resource map, and others.
Fig. 5.11 “Aguaje”, which is the dominant vegetation type in peatlands in the Amazon
5 Evaluation of Eco-Management of Tropical Peatlands
183