

covariance flux tower are used to calculate physical parameters such as wind
velocity, air/soil temperature, and CO 2 . Prior to the calculation process, many
types of data correction, quality control, and gap-filling must be applied.
The carbon emission model from peat decomposition is based on a linear
relationship between the NEE and GWL on an annual basis (Hirano et al. 2012).
Based on this relationship, the model allows us to estimate an annual NEE using the
lowest monthly average GWL. The NEE indicates the difference in CO 2 amount,
which is emitted by the ecosystem respiration and absorbed by photosynthesis (gross
primary production/GPP). Ecosystem respiration is found to increase with soil
temperature and decrease as GWL or soil moisture increases (Kechavarzi et al.
2010). In forest ecosystems, CO 2 exchange between the atmosphere usually
occupies most of the carbon flow. In the case in which other carbon is negligible,
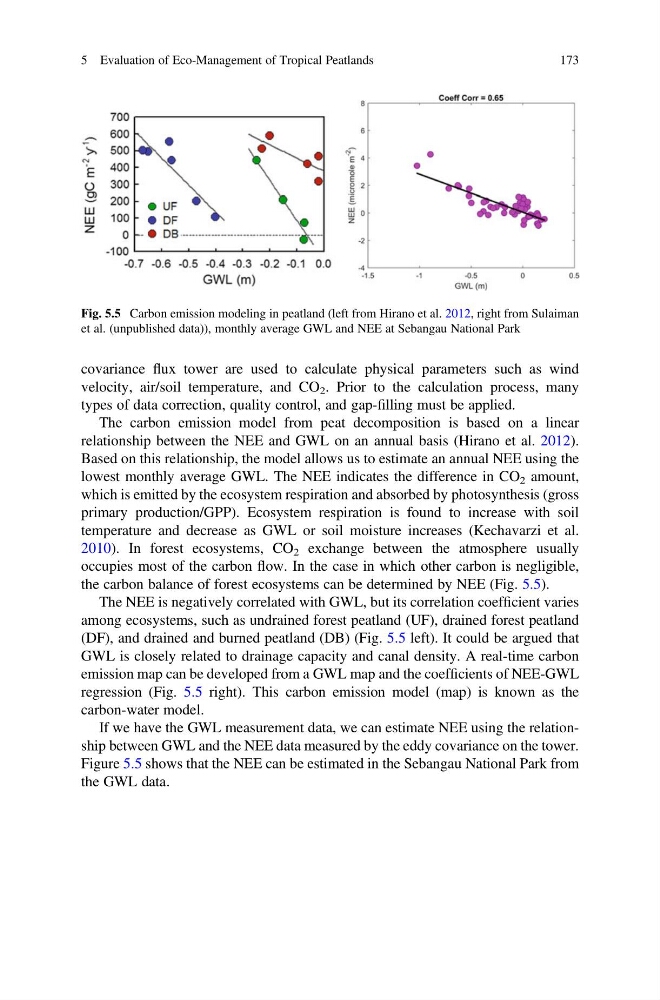
the carbon balance of forest ecosystems can be determined by NEE (Fig. 5.5).
The NEE is negatively correlated with GWL, but its correlation coefficient varies
among ecosystems, such as undrained forest peatland (UF), drained forest peatland
(DF), and drained and burned peatland (DB) (Fig. 5.5 left). It could be argued that
GWL is closely related to drainage capacity and canal density. A real-time carbon
emission map can be developed from a GWL map and the coefficients of NEE-GWL
regression (Fig. 5.5 right). This carbon emission model (map) is known as the
carbon-water model.
If we have the GWL measurement data, we can estimate NEE using the relationship between GWL and the NEE data measured by the eddy covariance on the tower.
Figure 5.5 shows that the NEE can be estimated in the Sebangau National Park from
the GWL data.
Fig. 5.5 Carbon emission modeling in peatland (left from Hirano et al. 2012, right from Sulaiman
et al. (unpublished data)), monthly average GWL and NEE at Sebangau National Park
5 Evaluation of Eco-Management of Tropical Peatlands
173
velocity, air/soil temperature, and CO 2 . Prior to the calculation process, many
types of data correction, quality control, and gap-filling must be applied.
The carbon emission model from peat decomposition is based on a linear
relationship between the NEE and GWL on an annual basis (Hirano et al. 2012).
Based on this relationship, the model allows us to estimate an annual NEE using the
lowest monthly average GWL. The NEE indicates the difference in CO 2 amount,
which is emitted by the ecosystem respiration and absorbed by photosynthesis (gross
primary production/GPP). Ecosystem respiration is found to increase with soil
temperature and decrease as GWL or soil moisture increases (Kechavarzi et al.
2010). In forest ecosystems, CO 2 exchange between the atmosphere usually
occupies most of the carbon flow. In the case in which other carbon is negligible,
the carbon balance of forest ecosystems can be determined by NEE (Fig. 5.5).
The NEE is negatively correlated with GWL, but its correlation coefficient varies
among ecosystems, such as undrained forest peatland (UF), drained forest peatland
(DF), and drained and burned peatland (DB) (Fig. 5.5 left). It could be argued that
GWL is closely related to drainage capacity and canal density. A real-time carbon
emission map can be developed from a GWL map and the coefficients of NEE-GWL
regression (Fig. 5.5 right). This carbon emission model (map) is known as the
carbon-water model.
If we have the GWL measurement data, we can estimate NEE using the relationship between GWL and the NEE data measured by the eddy covariance on the tower.
Figure 5.5 shows that the NEE can be estimated in the Sebangau National Park from
the GWL data.
Fig. 5.5 Carbon emission modeling in peatland (left from Hirano et al. 2012, right from Sulaiman
et al. (unpublished data)), monthly average GWL and NEE at Sebangau National Park
5 Evaluation of Eco-Management of Tropical Peatlands
173