

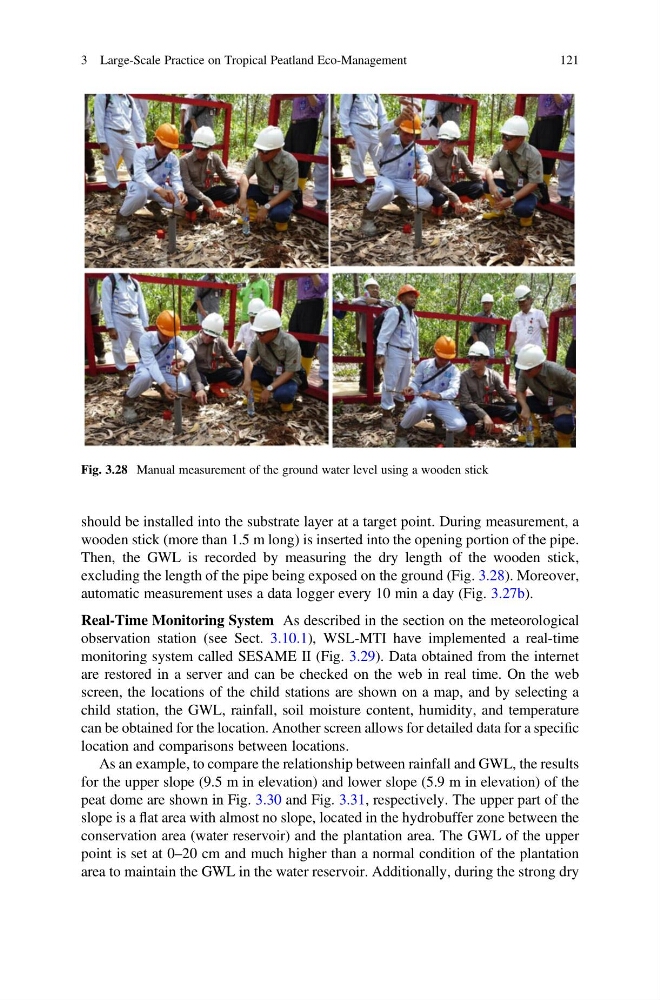
should be installed into the substrate layer at a target point. During measurement, a
wooden stick (more than 1.5 m long) is inserted into the opening portion of the pipe.
Then, the GWL is recorded by measuring the dry length of the wooden stick,
excluding the length of the pipe being exposed on the ground (Fig. 3.28). Moreover,
automatic measurement uses a data logger every 10 min a day (Fig. 3.27b).
Real-Time Monitoring System As described in the section on the meteorological
observation station (see Sect. 3.10.1), WSL-MTI have implemented a real-time
monitoring system called SESAME II (Fig. 3.29). Data obtained from the internet
are restored in a server and can be checked on the web in real time. On the web
screen, the locations of the child stations are shown on a map, and by selecting a
child station, the GWL, rainfall, soil moisture content, humidity, and temperature
can be obtained for the location. Another screen allows for detailed data for a specific
location and comparisons between locations.
As an example, to compare the relationship between rainfall and GWL, the results
for the upper slope (9.5 m in elevation) and lower slope (5.9 m in elevation) of the
peat dome are shown in Fig. 3.30 and Fig. 3.31, respectively. The upper part of the
slope is a flat area with almost no slope, located in the hydrobuffer zone between the
conservation area (water reservoir) and the plantation area. The GWL of the upper
point is set at 0–20 cm and much higher than a normal condition of the plantation
area to maintain the GWL in the water reservoir. Additionally, during the strong dry
Fig. 3.28 Manual measurement of the ground water level using a wooden stick
3 Large-Scale Practice on Tropical Peatland Eco-Management
121
wooden stick (more than 1.5 m long) is inserted into the opening portion of the pipe.
Then, the GWL is recorded by measuring the dry length of the wooden stick,
excluding the length of the pipe being exposed on the ground (Fig. 3.28). Moreover,
automatic measurement uses a data logger every 10 min a day (Fig. 3.27b).
Real-Time Monitoring System As described in the section on the meteorological
observation station (see Sect. 3.10.1), WSL-MTI have implemented a real-time
monitoring system called SESAME II (Fig. 3.29). Data obtained from the internet
are restored in a server and can be checked on the web in real time. On the web
screen, the locations of the child stations are shown on a map, and by selecting a
child station, the GWL, rainfall, soil moisture content, humidity, and temperature
can be obtained for the location. Another screen allows for detailed data for a specific
location and comparisons between locations.
As an example, to compare the relationship between rainfall and GWL, the results
for the upper slope (9.5 m in elevation) and lower slope (5.9 m in elevation) of the
peat dome are shown in Fig. 3.30 and Fig. 3.31, respectively. The upper part of the
slope is a flat area with almost no slope, located in the hydrobuffer zone between the
conservation area (water reservoir) and the plantation area. The GWL of the upper
point is set at 0–20 cm and much higher than a normal condition of the plantation
area to maintain the GWL in the water reservoir. Additionally, during the strong dry
Fig. 3.28 Manual measurement of the ground water level using a wooden stick
3 Large-Scale Practice on Tropical Peatland Eco-Management
121