

566
K. Kleinknecht and U. Uwer
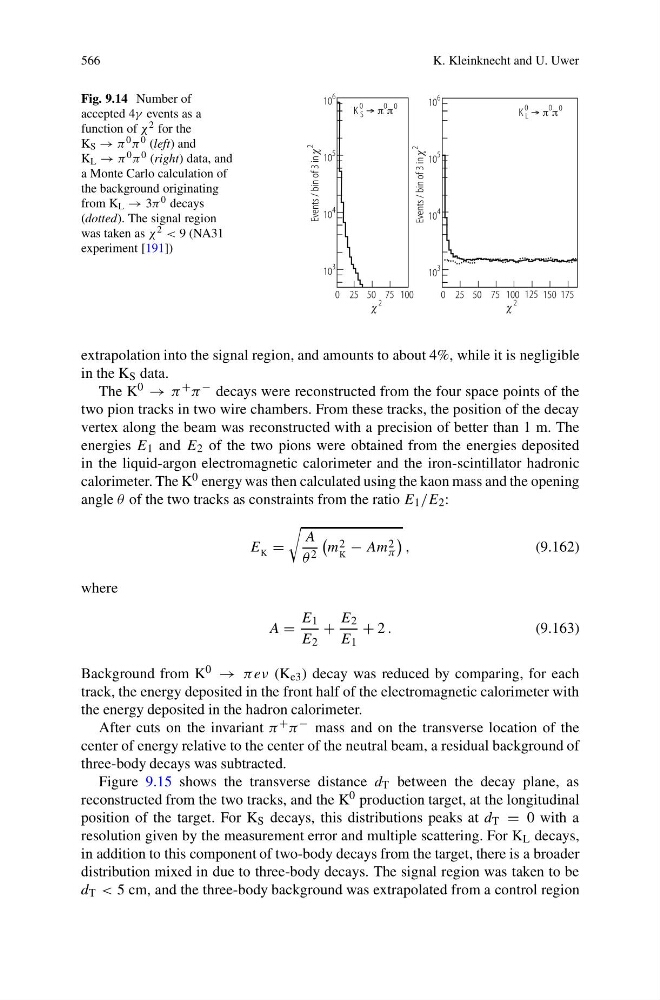
Fig. 9.14 Number of
accepted 4γ events as a
function of χ 2 for the
K S → π 0 π 0 (left) and
K L → π 0 π 0 (right) data, and
a Monte Carlo calculation of
the background originating
from K L → 3π 0 decays
(dotted). The signal region
was taken as χ 2 < 9 (NA31
experiment [191])
extrapolation into the signal region, and amounts to about 4%, while it is negligible
in the K S data.
The K 0 → π + π − decays were reconstructed from the four space points of the
two pion tracks in two wire chambers. From these tracks, the position of the decay
vertex along the beam was reconstructed with a precision of better than 1 m. The
energies E 1 and E 2 of the two pions were obtained from the energies deposited
in the liquid-argon electromagnetic calorimeter and the iron-scintillator hadronic
calorimeter. The K 0 energy was then calculated using the kaon mass and the opening
angle θ of the two tracks as constraints from the ratio E 1 /E 2 :
E K =
A
θ 2
m 2
K
− Am 2
π
,
(9.162)
where
A =
E 1
E 2
+
E 2
E 1
+ 2 .
(9.163)
Background from K 0 → πeν (K e3 ) decay was reduced by comparing, for each
track, the energy deposited in the front half of the electromagnetic calorimeter with
the energy deposited in the hadron calorimeter.
After cuts on the invariant π + π − mass and on the transverse location of the
center of energy relative to the center of the neutral beam, a residual background of
three-body decays was subtracted.
Figure 9.15 shows the transverse distance d T between the decay plane, as
reconstructed from the two tracks, and the K 0 production target, at the longitudinal
position of the target. For K S decays, this distributions peaks at d T = 0 with a
resolution given by the measurement error and multiple scattering. For K L decays,
in addition to this component of two-body decays from the target, there is a broader
distribution mixed in due to three-body decays. The signal region was taken to be
d T < 5 cm, and the three-body background was extrapolated from a control region
K. Kleinknecht and U. Uwer
Fig. 9.14 Number of
accepted 4γ events as a
function of χ 2 for the
K S → π 0 π 0 (left) and
K L → π 0 π 0 (right) data, and
a Monte Carlo calculation of
the background originating
from K L → 3π 0 decays
(dotted). The signal region
was taken as χ 2 < 9 (NA31
experiment [191])
extrapolation into the signal region, and amounts to about 4%, while it is negligible
in the K S data.
The K 0 → π + π − decays were reconstructed from the four space points of the
two pion tracks in two wire chambers. From these tracks, the position of the decay
vertex along the beam was reconstructed with a precision of better than 1 m. The
energies E 1 and E 2 of the two pions were obtained from the energies deposited
in the liquid-argon electromagnetic calorimeter and the iron-scintillator hadronic
calorimeter. The K 0 energy was then calculated using the kaon mass and the opening
angle θ of the two tracks as constraints from the ratio E 1 /E 2 :
E K =
A
θ 2
m 2
K
− Am 2
π
,
(9.162)
where
A =
E 1
E 2
+
E 2
E 1
+ 2 .
(9.163)
Background from K 0 → πeν (K e3 ) decay was reduced by comparing, for each
track, the energy deposited in the front half of the electromagnetic calorimeter with
the energy deposited in the hadron calorimeter.
After cuts on the invariant π + π − mass and on the transverse location of the
center of energy relative to the center of the neutral beam, a residual background of
three-body decays was subtracted.
Figure 9.15 shows the transverse distance d T between the decay plane, as
reconstructed from the two tracks, and the K 0 production target, at the longitudinal
position of the target. For K S decays, this distributions peaks at d T = 0 with a
resolution given by the measurement error and multiple scattering. For K L decays,
in addition to this component of two-body decays from the target, there is a broader
distribution mixed in due to three-body decays. The signal region was taken to be
d T < 5 cm, and the three-body background was extrapolated from a control region