

9 Symmetry Violations and Quark Flavour Physics
559
9.5.5.3 Measurements of +− in Vacuum Interference Experiments
The other method for measuring Φ +− is the vacuum interference method mentioned
above (Sect. 9.5.3.1), where one observes the K → π + π − distribution obtained
from an initially pure strangeness state. The information on Φ +− is contained in the
interference term proportional to cos((m τ − Φ +− ), and the time at which the two
interfering amplitudes are equal is ∼ 12τ S , so that the correlation of Φ +− with m
is rather strong.
Three experiments of this type have been done in the intermediate-energy domain
[166, 182, 183]. An analysis of the latest and most precise of those has been
performed by the CERN–Heidelberg group [166]. The apparatus was situated in
a 75 mrad short neutral beam derived from 24 GeV/c protons. The time distribution
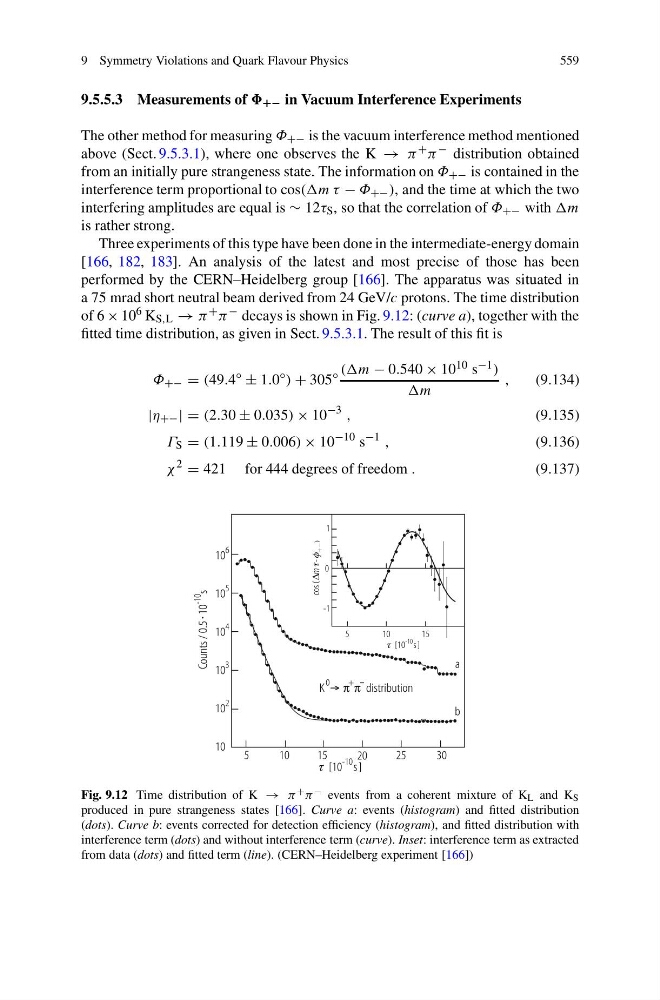
of 6 × 10 6 K S,L → π + π − decays is shown in Fig. 9.12: (curve a), together with the
fitted time distribution, as given in Sect. 9.5.3.1. The result of this fit is
Φ +− = (49.4
◦
± 1.0
◦ ) + 305
◦ ((m − 0.540 × 10 10 s −1 )
,
(9.134)
|η +− | = (2.30 ± 0.035) × 10
−3 ,
(9.135)
Γ S = (1.119 ± 0.006) × 10
−10 s
−1 ,
(9.136)
χ
2
= 421 for 444 degrees of freedom .
(9.137)
Fig. 9.12 Time distribution of K → π + π − events from a coherent mixture of K L and K S
produced in pure strangeness states [166]. Curve a: events (histogram) and fitted distribution
(dots). Curve b: events corrected for detection efficiency (histogram), and fitted distribution with
interference term (dots) and without interference term (curve). Inset: interference term as extracted
from data (dots) and fitted term (line). (CERN–Heidelberg experiment [166])
559
9.5.5.3 Measurements of +− in Vacuum Interference Experiments
The other method for measuring Φ +− is the vacuum interference method mentioned
above (Sect. 9.5.3.1), where one observes the K → π + π − distribution obtained
from an initially pure strangeness state. The information on Φ +− is contained in the
interference term proportional to cos((m τ − Φ +− ), and the time at which the two
interfering amplitudes are equal is ∼ 12τ S , so that the correlation of Φ +− with m
is rather strong.
Three experiments of this type have been done in the intermediate-energy domain
[166, 182, 183]. An analysis of the latest and most precise of those has been
performed by the CERN–Heidelberg group [166]. The apparatus was situated in
a 75 mrad short neutral beam derived from 24 GeV/c protons. The time distribution
of 6 × 10 6 K S,L → π + π − decays is shown in Fig. 9.12: (curve a), together with the
fitted time distribution, as given in Sect. 9.5.3.1. The result of this fit is
Φ +− = (49.4
◦
± 1.0
◦ ) + 305
◦ ((m − 0.540 × 10 10 s −1 )
,
(9.134)
|η +− | = (2.30 ± 0.035) × 10
−3 ,
(9.135)
Γ S = (1.119 ± 0.006) × 10
−10 s
−1 ,
(9.136)
χ
2
= 421 for 444 degrees of freedom .
(9.137)
Fig. 9.12 Time distribution of K → π + π − events from a coherent mixture of K L and K S
produced in pure strangeness states [166]. Curve a: events (histogram) and fitted distribution
(dots). Curve b: events corrected for detection efficiency (histogram), and fitted distribution with
interference term (dots) and without interference term (curve). Inset: interference term as extracted
from data (dots) and fitted term (line). (CERN–Heidelberg experiment [166])