

384
R. Stock
[182], the central to peripheral yield ratio referring to a 5%, and a 60–80% cut of
minimum bias data. We showed in Eq. (7.56) that the R CP measure also refers to a
picture of pQCD number of binary collision scaling, inappropriate at low p T . Thus
ignoring the features of Fig. 7.45 at p T ≤ 3 GeV/c we conclude that the high p T
data again suggest a suppression by about 0.3, common to pions and protons, thus
approaching the ratio, of about 0.2, observed in Figs. 7.41 and 7.42 which employ
the “ideal” in-vacuum p + p → hadron + X reference.
At top SPS energy,
√
s = 17.3 GeV, the experimentally covered p T range is
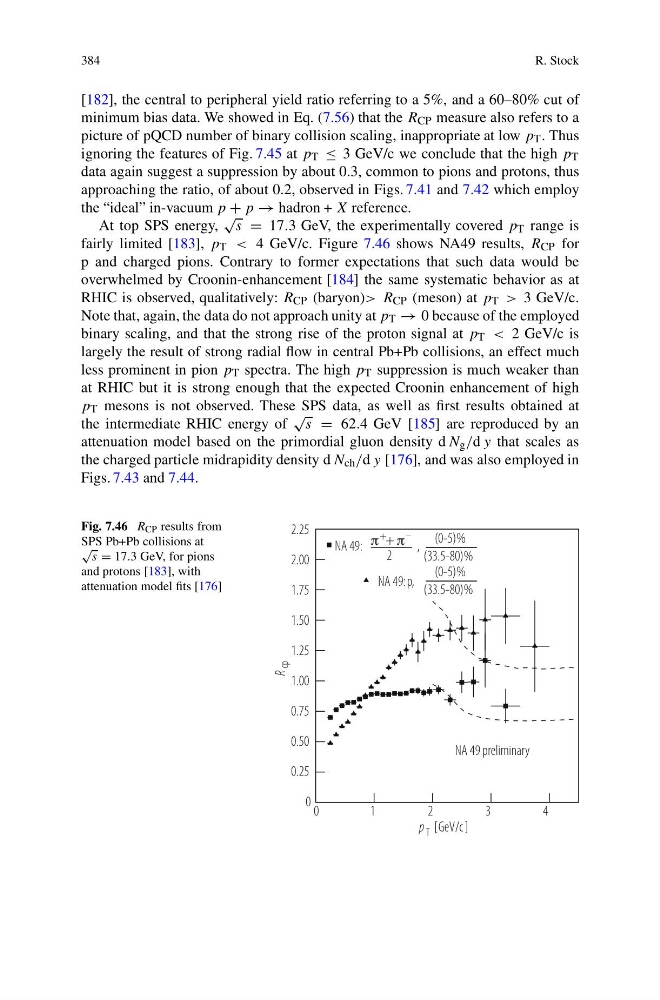
fairly limited [183], p T < 4 GeV/c. Figure 7.46 shows NA49 results, R CP for
p and charged pions. Contrary to former expectations that such data would be
overwhelmed by Croonin-enhancement [184] the same systematic behavior as at
RHIC is observed, qualitatively: R CP (baryon)> R CP (meson) at p T > 3 GeV/c.
Note that, again, the data do not approach unity at p T → 0 because of the employed
binary scaling, and that the strong rise of the proton signal at p T < 2 GeV/c is
largely the result of strong radial flow in central Pb+Pb collisions, an effect much
less prominent in pion p T spectra. The high p T suppression is much weaker than
at RHIC but it is strong enough that the expected Croonin enhancement of high
p T mesons is not observed. These SPS data, as well as first results obtained at
the intermediate RHIC energy of
√
s = 62.4 GeV [185] are reproduced by an
attenuation model based on the primordial gluon density d N g /d y that scales as
the charged particle midrapidity density d N ch /d y [176], and was also employed in
Figs. 7.43 and 7.44.
Fig. 7.46 R CP results from
SPS Pb+Pb collisions at
√
s = 17.3 GeV, for pions
and protons [183], with
attenuation model fits [176]
p T [GeV/c]
R p
c
2.25
2.00
1.75
1.50
1.25
1.00
0.75
0.50
0.25
0 0
1
2
3
4
NA 49 preliminary
NA 49:
+
+
–
2
,
(0-5)%
(0-5)%
(33.5-80)%
(33.5-80)%
NA 49:p,
R. Stock
[182], the central to peripheral yield ratio referring to a 5%, and a 60–80% cut of
minimum bias data. We showed in Eq. (7.56) that the R CP measure also refers to a
picture of pQCD number of binary collision scaling, inappropriate at low p T . Thus
ignoring the features of Fig. 7.45 at p T ≤ 3 GeV/c we conclude that the high p T
data again suggest a suppression by about 0.3, common to pions and protons, thus
approaching the ratio, of about 0.2, observed in Figs. 7.41 and 7.42 which employ
the “ideal” in-vacuum p + p → hadron + X reference.
At top SPS energy,
√
s = 17.3 GeV, the experimentally covered p T range is
fairly limited [183], p T < 4 GeV/c. Figure 7.46 shows NA49 results, R CP for
p and charged pions. Contrary to former expectations that such data would be
overwhelmed by Croonin-enhancement [184] the same systematic behavior as at
RHIC is observed, qualitatively: R CP (baryon)> R CP (meson) at p T > 3 GeV/c.
Note that, again, the data do not approach unity at p T → 0 because of the employed
binary scaling, and that the strong rise of the proton signal at p T < 2 GeV/c is
largely the result of strong radial flow in central Pb+Pb collisions, an effect much
less prominent in pion p T spectra. The high p T suppression is much weaker than
at RHIC but it is strong enough that the expected Croonin enhancement of high
p T mesons is not observed. These SPS data, as well as first results obtained at
the intermediate RHIC energy of
√
s = 62.4 GeV [185] are reproduced by an
attenuation model based on the primordial gluon density d N g /d y that scales as
the charged particle midrapidity density d N ch /d y [176], and was also employed in
Figs. 7.43 and 7.44.
Fig. 7.46 R CP results from
SPS Pb+Pb collisions at
√
s = 17.3 GeV, for pions
and protons [183], with
attenuation model fits [176]
p T [GeV/c]
R p
c
2.25
2.00
1.75
1.50
1.25
1.00
0.75
0.50
0.25
0 0
1
2
3
4
NA 49 preliminary
NA 49:
+
+
–
2
,
(0-5)%
(0-5)%
(33.5-80)%
(33.5-80)%
NA 49:p,