

7 Relativistic Nucleus-Nucleus Collisions and the QCD Matter Phase Diagram
383
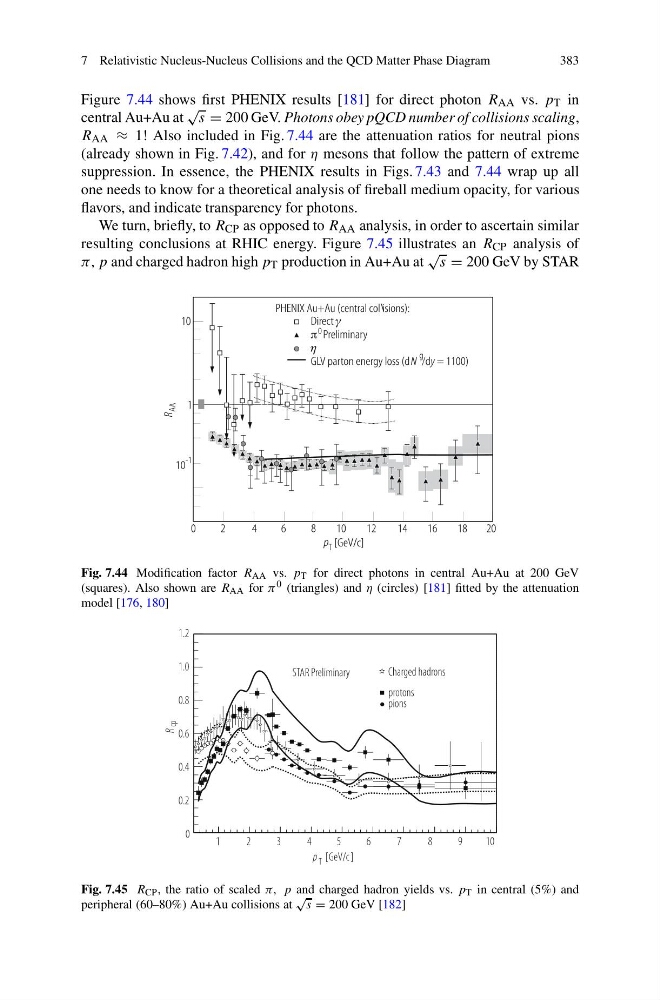
Figure 7.44 shows first PHENIX results [181] for direct photon R AA vs. p T in
central Au+Au at
√
s = 200 GeV. Photons obey pQCD number of collisions scaling,
R AA ≈ 1! Also included in Fig. 7.44 are the attenuation ratios for neutral pions
(already shown in Fig. 7.42), and for η mesons that follow the pattern of extreme
suppression. In essence, the PHENIX results in Figs. 7.43 and 7.44 wrap up all
one needs to know for a theoretical analysis of fireball medium opacity, for various
flavors, and indicate transparency for photons.
We turn, briefly, to R CP as opposed to R AA analysis, in order to ascertain similar
resulting conclusions at RHIC energy. Figure 7.45 illustrates an R CP analysis of
π, p and charged hadron high p T production in Au+Au at
√
s = 200 GeV by STAR
Fig. 7.44 Modification factor R AA vs. p T for direct photons in central Au+Au at 200 GeV
(squares). Also shown are R AA for π 0 (triangles) and η (circles) [181] fitted by the attenuation
model [176, 180]
STAR Preliminary
Charged hadrons
protons
pions
1.2
1.0
0.8
0.6
0.4
0.2
0
1
2
3
4
5
6
7
8
9
10
p T [GeV/c]
R p
c
Fig. 7.45 R CP , the ratio of scaled π, p and charged hadron yields vs. p T in central (5%) and
peripheral (60–80%) Au+Au collisions at
√
s = 200 GeV [182]
383
Figure 7.44 shows first PHENIX results [181] for direct photon R AA vs. p T in
central Au+Au at
√
s = 200 GeV. Photons obey pQCD number of collisions scaling,
R AA ≈ 1! Also included in Fig. 7.44 are the attenuation ratios for neutral pions
(already shown in Fig. 7.42), and for η mesons that follow the pattern of extreme
suppression. In essence, the PHENIX results in Figs. 7.43 and 7.44 wrap up all
one needs to know for a theoretical analysis of fireball medium opacity, for various
flavors, and indicate transparency for photons.
We turn, briefly, to R CP as opposed to R AA analysis, in order to ascertain similar
resulting conclusions at RHIC energy. Figure 7.45 illustrates an R CP analysis of
π, p and charged hadron high p T production in Au+Au at
√
s = 200 GeV by STAR
Fig. 7.44 Modification factor R AA vs. p T for direct photons in central Au+Au at 200 GeV
(squares). Also shown are R AA for π 0 (triangles) and η (circles) [181] fitted by the attenuation
model [176, 180]
STAR Preliminary
Charged hadrons
protons
pions
1.2
1.0
0.8
0.6
0.4
0.2
0
1
2
3
4
5
6
7
8
9
10
p T [GeV/c]
R p
c
Fig. 7.45 R CP , the ratio of scaled π, p and charged hadron yields vs. p T in central (5%) and
peripheral (60–80%) Au+Au collisions at
√
s = 200 GeV [182]