

364
R. Stock
In particular for small x (volume), η(s) → (x/2) s , and one expects that the larger
the strangeness content of the particle the smaller the suppression factor, and hence
the larger the enhancement in going from elementary to central A+A collisions. This
explains the hierarchy addressed in Eq. (7.40), and apparent from the data shown in
Fig. 7.29. In fact, the curves shown in this figure represent the results obtained from
Eq. (7.45), for s = 1, 2, 3 hyperon production at
√
s = 17.3 GeV [119]. They
are seen to be in qualitative agreement with the data. However the scarcity of data,
existing at top SPS energy for total hyperon yields, obtained in 4π acceptance (recall
the arguments in Sect. 7.3.1) both for A+A and p+p collisions does not yet permit
to cover the SHM strangeness saturation curves in detail, for s > 1.
This saturation is seen in Fig. 7.29, to set in already at modest system sizes, but
sequentially so, for ascending hyperon strangeness. Note that SHM saturation is
sequentially approached, from Eq. (7.45), with increasing fireball volume V . In
order to make contact to the experimental size scaling with centrality, e.g. N part ,
the model of ref. [119], which is illustrated in Fig. 7.29, has converted the genuine
volume scale to the N part scale by assuming a universal eigenvolume of 7 fm 3 per
participant nucleon. I.e. N part = 10 really means a coherent fireball volume of
70 fm 3 , in Fig. 7.29. Within this definition, saturation of s = 1, 2, 3 sets in at fireball
volumes at hadronization of about 60, 240 and 600 fm 3 , respectively: this is the real
message of the SHM curves in Fig. 7.29.
The above direct translation of coherent fireball volume to participant number is
problematic [120] as it assumes that all participating nucleons enter into a single
primordially coherent fireball. This is, however, not the case [120] particularly in
the relative small scattering systems that cover the initial, steep increase of η(s),
where several local high density clusters are formed, each containing a fraction of
N part . This is revealed by a percolation model [120] of cluster overlap attached to a
Glauber calculation of the collision/energy density. At each N part an average cluster
volume distribution results which can be transformed by Eq. (7.45) to an average
{η(s, V )} distribution whose weighted mean is the appropriate effective canonical
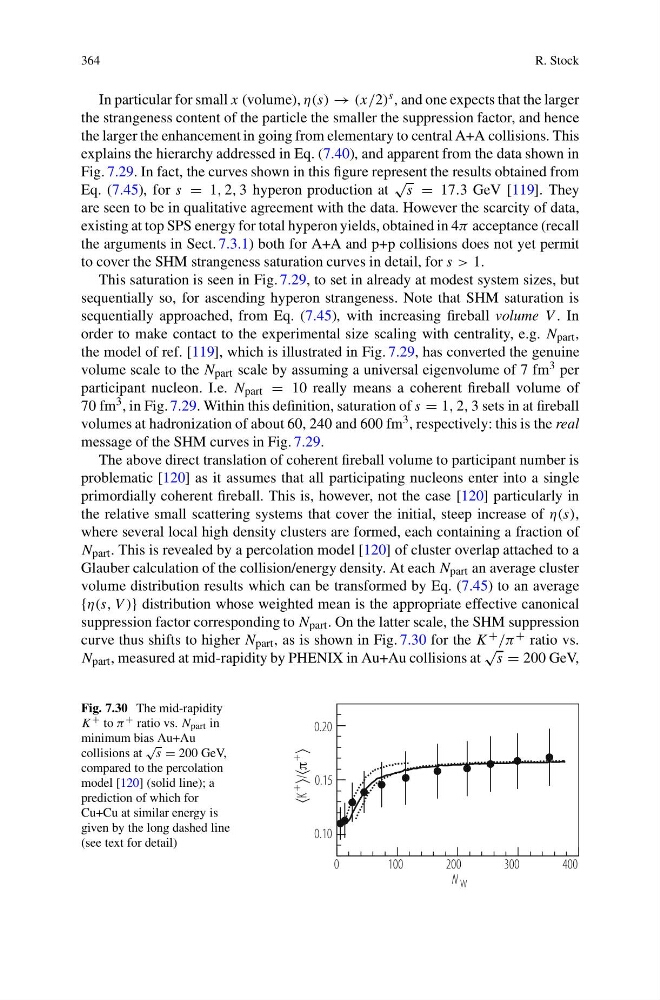
suppression factor corresponding to N part . On the latter scale, the SHM suppression
curve thus shifts to higher N part , as is shown in Fig. 7.30 for the K + /π + ratio vs.
N part , measured at mid-rapidity by PHENIX in Au+Au collisions at
√
s = 200 GeV,
Fig. 7.30 The mid-rapidity
K + to π + ratio vs. N part in
minimum bias Au+Au
collisions at
√
s = 200 GeV,
compared to the percolation
model [120] (solid line); a
prediction of which for
Cu+Cu at similar energy is
given by the long dashed line
(see text for detail)
0.10
0.15
0.20
0
100
200
300
400
N W
/
K
+
+
R. Stock
In particular for small x (volume), η(s) → (x/2) s , and one expects that the larger
the strangeness content of the particle the smaller the suppression factor, and hence
the larger the enhancement in going from elementary to central A+A collisions. This
explains the hierarchy addressed in Eq. (7.40), and apparent from the data shown in
Fig. 7.29. In fact, the curves shown in this figure represent the results obtained from
Eq. (7.45), for s = 1, 2, 3 hyperon production at
√
s = 17.3 GeV [119]. They
are seen to be in qualitative agreement with the data. However the scarcity of data,
existing at top SPS energy for total hyperon yields, obtained in 4π acceptance (recall
the arguments in Sect. 7.3.1) both for A+A and p+p collisions does not yet permit
to cover the SHM strangeness saturation curves in detail, for s > 1.
This saturation is seen in Fig. 7.29, to set in already at modest system sizes, but
sequentially so, for ascending hyperon strangeness. Note that SHM saturation is
sequentially approached, from Eq. (7.45), with increasing fireball volume V . In
order to make contact to the experimental size scaling with centrality, e.g. N part ,
the model of ref. [119], which is illustrated in Fig. 7.29, has converted the genuine
volume scale to the N part scale by assuming a universal eigenvolume of 7 fm 3 per
participant nucleon. I.e. N part = 10 really means a coherent fireball volume of
70 fm 3 , in Fig. 7.29. Within this definition, saturation of s = 1, 2, 3 sets in at fireball
volumes at hadronization of about 60, 240 and 600 fm 3 , respectively: this is the real
message of the SHM curves in Fig. 7.29.
The above direct translation of coherent fireball volume to participant number is
problematic [120] as it assumes that all participating nucleons enter into a single
primordially coherent fireball. This is, however, not the case [120] particularly in
the relative small scattering systems that cover the initial, steep increase of η(s),
where several local high density clusters are formed, each containing a fraction of
N part . This is revealed by a percolation model [120] of cluster overlap attached to a
Glauber calculation of the collision/energy density. At each N part an average cluster
volume distribution results which can be transformed by Eq. (7.45) to an average
{η(s, V )} distribution whose weighted mean is the appropriate effective canonical
suppression factor corresponding to N part . On the latter scale, the SHM suppression
curve thus shifts to higher N part , as is shown in Fig. 7.30 for the K + /π + ratio vs.
N part , measured at mid-rapidity by PHENIX in Au+Au collisions at
√
s = 200 GeV,
Fig. 7.30 The mid-rapidity
K + to π + ratio vs. N part in
minimum bias Au+Au
collisions at
√
s = 200 GeV,
compared to the percolation
model [120] (solid line); a
prediction of which for
Cu+Cu at similar energy is
given by the long dashed line
(see text for detail)
0.10
0.15
0.20
0
100
200
300
400
N W
/
K
+
+