

7 Relativistic Nucleus-Nucleus Collisions and the QCD Matter Phase Diagram
349
with a universal inverse slope parameter T and a species dependent normalization
factor A. Hagedorn showed [99] that this scaling is characteristic of an adiabatic
expansion of a fireball at temperature T . We recall that, on the other hand, an ideal
hydrodynamical expansion is isentropic.
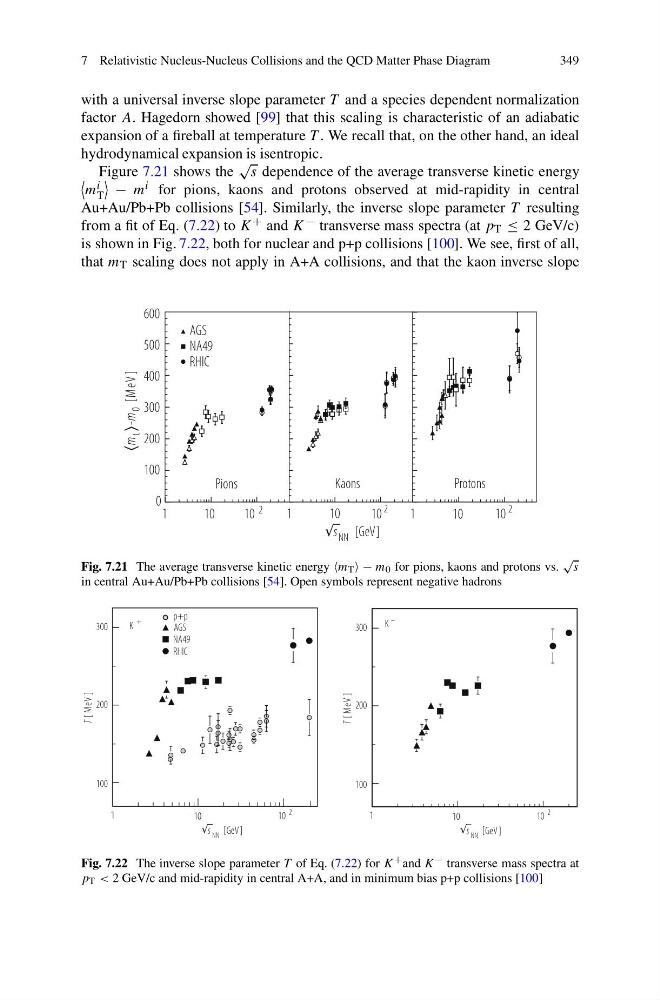
Figure 7.21 shows the
√
s dependence of the average transverse kinetic energy
m i
T
− m i for pions, kaons and protons observed at mid-rapidity in central
Au+Au/Pb+Pb collisions [54]. Similarly, the inverse slope parameter T resulting
from a fit of Eq. (7.22) to K + and K − transverse mass spectra (at p T ≤ 2 GeV/c)
is shown in Fig. 7.22, both for nuclear and p+p collisions [100]. We see, first of all,
that m T scaling does not apply in A+A collisions, and that the kaon inverse slope
Pions
Kaons
Protons
1
10
10 2
1
10
10
2
1
10
10 2
s NN [GeV]
600
500
400
300
200
100
0
m
m 0
t
]
V
e
M
[
-
AGS
NA49
RHIC
Fig. 7.21 The average transverse kinetic energy m T − m 0 for pions, kaons and protons vs.
√
s
in central Au+Au/Pb+Pb collisions [54]. Open symbols represent negative hadrons
[GeV ]
NN
s
1
10
2
10
T ]
V
e
M
[
100
200
300
+
K
AGS
NA49
RHIC
p+p
[GeV ]
NN
s
1
10
2
10
T ]
V
e
M
[
100
200
300
-
K
Fig. 7.22 The inverse slope parameter T of Eq. (7.22) for K + and K − transverse mass spectra at
p T < 2 GeV/c and mid-rapidity in central A+A, and in minimum bias p+p collisions [100]
349
with a universal inverse slope parameter T and a species dependent normalization
factor A. Hagedorn showed [99] that this scaling is characteristic of an adiabatic
expansion of a fireball at temperature T . We recall that, on the other hand, an ideal
hydrodynamical expansion is isentropic.
Figure 7.21 shows the
√
s dependence of the average transverse kinetic energy
m i
T
− m i for pions, kaons and protons observed at mid-rapidity in central
Au+Au/Pb+Pb collisions [54]. Similarly, the inverse slope parameter T resulting
from a fit of Eq. (7.22) to K + and K − transverse mass spectra (at p T ≤ 2 GeV/c)
is shown in Fig. 7.22, both for nuclear and p+p collisions [100]. We see, first of all,
that m T scaling does not apply in A+A collisions, and that the kaon inverse slope
Pions
Kaons
Protons
1
10
10 2
1
10
10
2
1
10
10 2
s NN [GeV]
600
500
400
300
200
100
0
m
m 0
t
]
V
e
M
[
-
AGS
NA49
RHIC
Fig. 7.21 The average transverse kinetic energy m T − m 0 for pions, kaons and protons vs.
√
s
in central Au+Au/Pb+Pb collisions [54]. Open symbols represent negative hadrons
[GeV ]
NN
s
1
10
2
10
T ]
V
e
M
[
100
200
300
+
K
AGS
NA49
RHIC
p+p
[GeV ]
NN
s
1
10
2
10
T ]
V
e
M
[
100
200
300
-
K
Fig. 7.22 The inverse slope parameter T of Eq. (7.22) for K + and K − transverse mass spectra at
p T < 2 GeV/c and mid-rapidity in central A+A, and in minimum bias p+p collisions [100]