

328
R. Stock
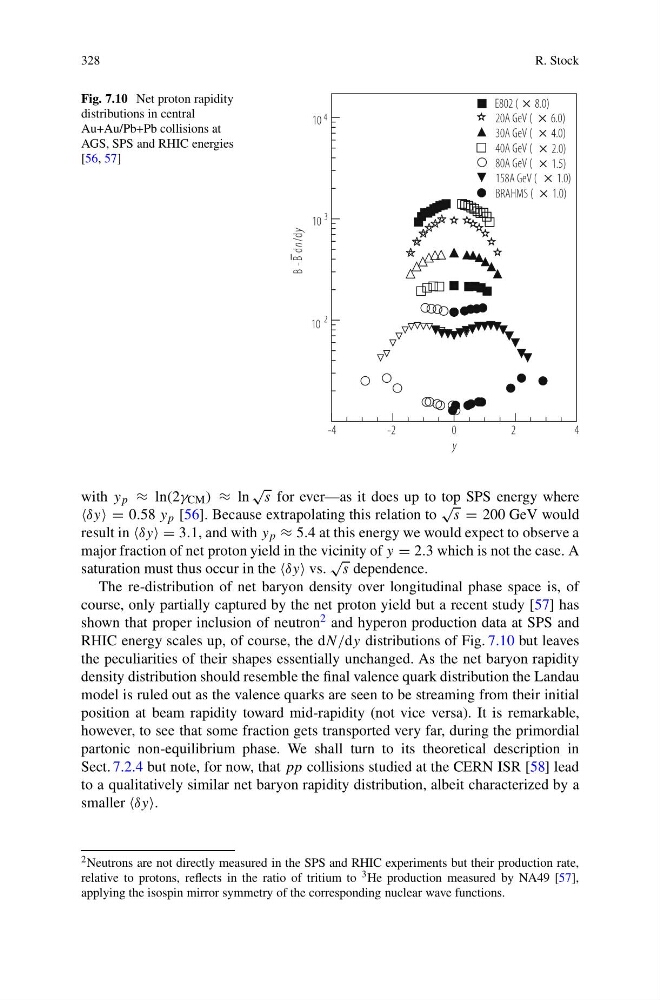
Fig. 7.10 Net proton rapidity
distributions in central
Au+Au/Pb+Pb collisions at
AGS, SPS and RHIC energies
[56, 57]
y
-4
-2
0
2
4
d
/
d
y
n B -
B
2
10
3
10
4
10
8.0)
E802 (
6.0)
20A GeV (
4.0)
30A GeV (
2.0)
40A GeV (
1.5)
80A GeV (
1.0)
158A GeV (
1.0)
BRAHMS (
with y p ≈ ln(2γ CM ) ≈ ln
√
s for ever—as it does up to top SPS energy where
δy = 0.58 y p [56]. Because extrapolating this relation to
√
s = 200 GeV would
result in δy = 3.1, and with y p ≈ 5.4 at this energy we would expect to observe a
major fraction of net proton yield in the vicinity of y = 2.3 which is not the case. A
saturation must thus occur in the δy vs.
√
s dependence.
The re-distribution of net baryon density over longitudinal phase space is, of
course, only partially captured by the net proton yield but a recent study [57] has
shown that proper inclusion of neutron 2 and hyperon production data at SPS and
RHIC energy scales up, of course, the dN/dy distributions of Fig. 7.10 but leaves
the peculiarities of their shapes essentially unchanged. As the net baryon rapidity
density distribution should resemble the final valence quark distribution the Landau
model is ruled out as the valence quarks are seen to be streaming from their initial
position at beam rapidity toward mid-rapidity (not vice versa). It is remarkable,
however, to see that some fraction gets transported very far, during the primordial
partonic non-equilibrium phase. We shall turn to its theoretical description in
Sect. 7.2.4 but note, for now, that pp collisions studied at the CERN ISR [58] lead
to a qualitatively similar net baryon rapidity distribution, albeit characterized by a
smaller δy.
2 Neutrons are not directly measured in the SPS and RHIC experiments but their production rate,
relative to protons, reflects in the ratio of tritium to 3 He production measured by NA49 [57],
applying the isospin mirror symmetry of the corresponding nuclear wave functions.
R. Stock
Fig. 7.10 Net proton rapidity
distributions in central
Au+Au/Pb+Pb collisions at
AGS, SPS and RHIC energies
[56, 57]
y
-4
-2
0
2
4
d
/
d
y
n B -
B
2
10
3
10
4
10
8.0)
E802 (
6.0)
20A GeV (
4.0)
30A GeV (
2.0)
40A GeV (
1.5)
80A GeV (
1.0)
158A GeV (
1.0)
BRAHMS (
with y p ≈ ln(2γ CM ) ≈ ln
√
s for ever—as it does up to top SPS energy where
δy = 0.58 y p [56]. Because extrapolating this relation to
√
s = 200 GeV would
result in δy = 3.1, and with y p ≈ 5.4 at this energy we would expect to observe a
major fraction of net proton yield in the vicinity of y = 2.3 which is not the case. A
saturation must thus occur in the δy vs.
√
s dependence.
The re-distribution of net baryon density over longitudinal phase space is, of
course, only partially captured by the net proton yield but a recent study [57] has
shown that proper inclusion of neutron 2 and hyperon production data at SPS and
RHIC energy scales up, of course, the dN/dy distributions of Fig. 7.10 but leaves
the peculiarities of their shapes essentially unchanged. As the net baryon rapidity
density distribution should resemble the final valence quark distribution the Landau
model is ruled out as the valence quarks are seen to be streaming from their initial
position at beam rapidity toward mid-rapidity (not vice versa). It is remarkable,
however, to see that some fraction gets transported very far, during the primordial
partonic non-equilibrium phase. We shall turn to its theoretical description in
Sect. 7.2.4 but note, for now, that pp collisions studied at the CERN ISR [58] lead
to a qualitatively similar net baryon rapidity distribution, albeit characterized by a
smaller δy.
2 Neutrons are not directly measured in the SPS and RHIC experiments but their production rate,
relative to protons, reflects in the ratio of tritium to 3 He production measured by NA49 [57],
applying the isospin mirror symmetry of the corresponding nuclear wave functions.