

320
R. Stock
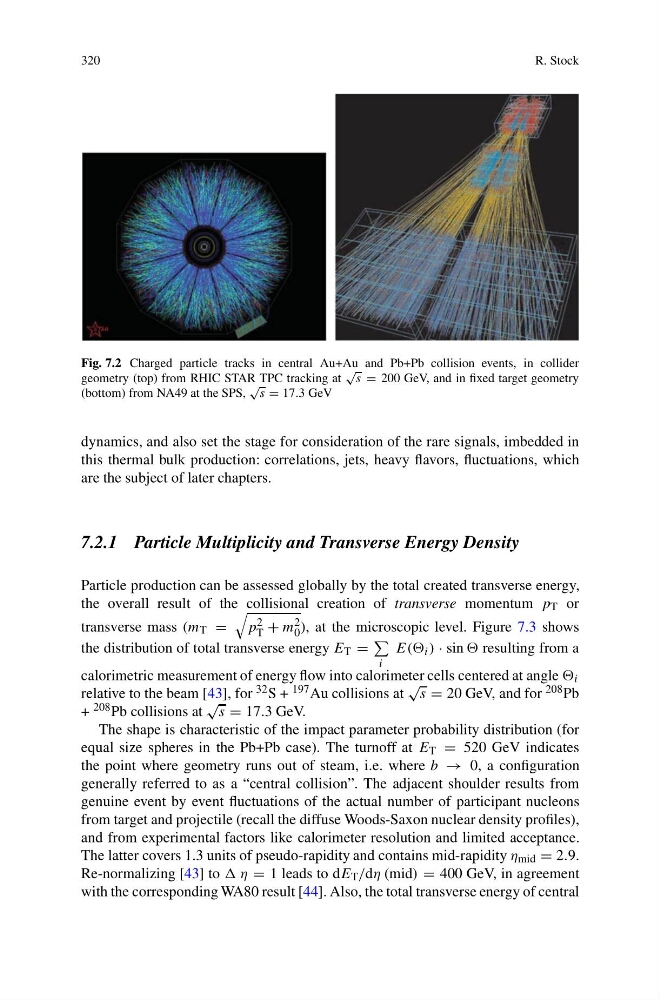
Fig. 7.2 Charged particle tracks in central Au+Au and Pb+Pb collision events, in collider
geometry (top) from RHIC STAR TPC tracking at
√
s = 200 GeV, and in fixed target geometry
(bottom) from NA49 at the SPS,
√
s = 17.3 GeV
dynamics, and also set the stage for consideration of the rare signals, imbedded in
this thermal bulk production: correlations, jets, heavy flavors, fluctuations, which
are the subject of later chapters.
7.2.1 Particle Multiplicity and Transverse Energy Density
Particle production can be assessed globally by the total created transverse energy,
the overall result of the collisional creation of transverse momentum p T or
transverse mass (m T =
p 2
T + m 2
0 ), at the microscopic level. Figure 7.3 shows
the distribution of total transverse energy E T =
i
E(( i ) · sin resulting from a
calorimetric measurement of energy flow into calorimeter cells centered at angle i
relative to the beam [43], for 32 S + 197 Au collisions at
√
s = 20 GeV, and for 208 Pb
+ 208 Pb collisions at
√
s = 17.3 GeV.
The shape is characteristic of the impact parameter probability distribution (for
equal size spheres in the Pb+Pb case). The turnoff at E T = 520 GeV indicates
the point where geometry runs out of steam, i.e. where b → 0, a configuration
generally referred to as a “central collision”. The adjacent shoulder results from
genuine event by event fluctuations of the actual number of participant nucleons
from target and projectile (recall the diffuse Woods-Saxon nuclear density profiles),
and from experimental factors like calorimeter resolution and limited acceptance.
The latter covers 1.3 units of pseudo-rapidity and contains mid-rapidity η mid = 2.9.
Re-normalizing [43] to η = 1 leads to dE T /dη (mid) = 400 GeV, in agreement
with the corresponding WA80 result [44]. Also, the total transverse energy of central
R. Stock
Fig. 7.2 Charged particle tracks in central Au+Au and Pb+Pb collision events, in collider
geometry (top) from RHIC STAR TPC tracking at
√
s = 200 GeV, and in fixed target geometry
(bottom) from NA49 at the SPS,
√
s = 17.3 GeV
dynamics, and also set the stage for consideration of the rare signals, imbedded in
this thermal bulk production: correlations, jets, heavy flavors, fluctuations, which
are the subject of later chapters.
7.2.1 Particle Multiplicity and Transverse Energy Density
Particle production can be assessed globally by the total created transverse energy,
the overall result of the collisional creation of transverse momentum p T or
transverse mass (m T =
p 2
T + m 2
0 ), at the microscopic level. Figure 7.3 shows
the distribution of total transverse energy E T =
i
E(( i ) · sin resulting from a
calorimetric measurement of energy flow into calorimeter cells centered at angle i
relative to the beam [43], for 32 S + 197 Au collisions at
√
s = 20 GeV, and for 208 Pb
+ 208 Pb collisions at
√
s = 17.3 GeV.
The shape is characteristic of the impact parameter probability distribution (for
equal size spheres in the Pb+Pb case). The turnoff at E T = 520 GeV indicates
the point where geometry runs out of steam, i.e. where b → 0, a configuration
generally referred to as a “central collision”. The adjacent shoulder results from
genuine event by event fluctuations of the actual number of participant nucleons
from target and projectile (recall the diffuse Woods-Saxon nuclear density profiles),
and from experimental factors like calorimeter resolution and limited acceptance.
The latter covers 1.3 units of pseudo-rapidity and contains mid-rapidity η mid = 2.9.
Re-normalizing [43] to η = 1 leads to dE T /dη (mid) = 400 GeV, in agreement
with the corresponding WA80 result [44]. Also, the total transverse energy of central