

290
P. Jenni and T. S. Virdee
50
13 TeV, 36.1 fb –1
Data
Signal (m H =125 GeV)
Background ZZ*
Background Z+jets, tt, tt+V, VVV
Uncertainty
H
ZZ*
4I
40
VBF
vH
ttH
ggF
1310
1180 80
92.8 2.8
1340 90
Inclusive
30
20
10
60
ATLAS
13 TeV, 36.1 fb –1
Stage 0 - |y H | < 2.5
Expected SM
Observed: Stat + Sys
SM Prediction
B [fb]
B/( B) SM
( B)
SM [fb]
H
ZZ*
4I
ATLAS
Events / 2.5 Gev
0
160
150
140
130
120
110
100
90
80
170
12
10
8
6
4
2
1
0
4
[GeV]
m 4I
FSR-corrected
+280
–250
370
< 200
(95% CL)
< 120
(95% CL)
+160
–140
1730
+260
–240
53
+3
–5
15.4
+1.1
–1.6
(a)
(b)
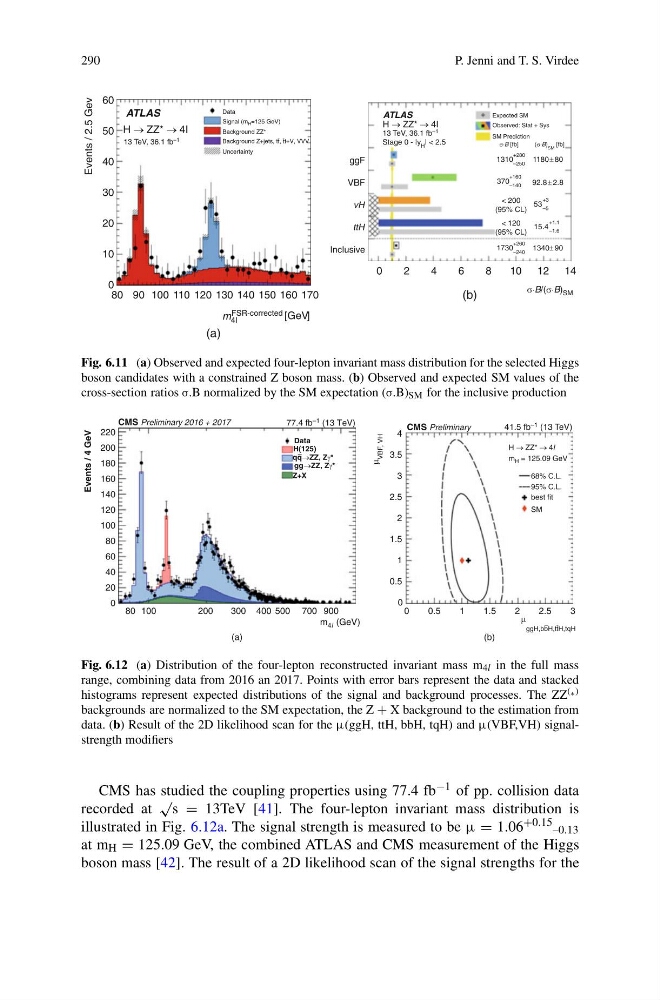
Fig. 6.11 (a) Observed and expected four-lepton invariant mass distribution for the selected Higgs
boson candidates with a constrained Z boson mass. (b) Observed and expected SM values of the
cross-section ratios σ.B normalized by the SM expectation (σ.B) SM for the inclusive production
Events / 4 GeV
VBF, VH
ggH,bbH,ttH,tqH
CMS Preliminary 2016 + 2017
CMS Preliminary
77.4 fb –1 (13 TeV)
41.5 fb –1 (13 TeV)
Data
H(125)
qq ZZ, *
gg ZZ, *
Z+X
200
180
160
140
120
100
80
60
40
20
220
3.5
3
2.5
2
1.5
1
0.5
4
0
2.5
2
1.5
1
0.5
3
0
0
700
m 4l (GeV)
500
400
300
(a)
(b)
200
100
80
900
H
ZZ*
4l
m H = 125.09 GeV
68% C.L.
95% C.L.
best fit
SM
Z
Z
Fig. 6.12 (a) Distribution of the four-lepton reconstructed invariant mass m 4l in the full mass
range, combining data from 2016 an 2017. Points with error bars represent the data and stacked
histograms represent expected distributions of the signal and background processes. The ZZ (∗)
backgrounds are normalized to the SM expectation, the Z + X background to the estimation from
data. (b) Result of the 2D likelihood scan for the μ(ggH, ttH, bbH, tqH) and μ(VBF,VH) signalstrength modifiers
CMS has studied the coupling properties using 77.4 fb −1 of pp. collision data
recorded at
√ s = 13TeV [41]. The four-lepton invariant mass distribution is
illustrated in Fig. 6.12a. The signal strength is measured to be μ = 1.06 +0.15 –0.13
at m H = 125.09 GeV, the combined ATLAS and CMS measurement of the Higgs
boson mass [42]. The result of a 2D likelihood scan of the signal strengths for the
P. Jenni and T. S. Virdee
50
13 TeV, 36.1 fb –1
Data
Signal (m H =125 GeV)
Background ZZ*
Background Z+jets, tt, tt+V, VVV
Uncertainty
H
ZZ*
4I
40
VBF
vH
ttH
ggF
1310
1180 80
92.8 2.8
1340 90
Inclusive
30
20
10
60
ATLAS
13 TeV, 36.1 fb –1
Stage 0 - |y H | < 2.5
Expected SM
Observed: Stat + Sys
SM Prediction
B [fb]
B/( B) SM
( B)
SM [fb]
H
ZZ*
4I
ATLAS
Events / 2.5 Gev
0
160
150
140
130
120
110
100
90
80
170
12
10
8
6
4
2
1
0
4
[GeV]
m 4I
FSR-corrected
+280
–250
370
< 200
(95% CL)
< 120
(95% CL)
+160
–140
1730
+260
–240
53
+3
–5
15.4
+1.1
–1.6
(a)
(b)
Fig. 6.11 (a) Observed and expected four-lepton invariant mass distribution for the selected Higgs
boson candidates with a constrained Z boson mass. (b) Observed and expected SM values of the
cross-section ratios σ.B normalized by the SM expectation (σ.B) SM for the inclusive production
Events / 4 GeV
VBF, VH
ggH,bbH,ttH,tqH
CMS Preliminary 2016 + 2017
CMS Preliminary
77.4 fb –1 (13 TeV)
41.5 fb –1 (13 TeV)
Data
H(125)
qq ZZ, *
gg ZZ, *
Z+X
200
180
160
140
120
100
80
60
40
20
220
3.5
3
2.5
2
1.5
1
0.5
4
0
2.5
2
1.5
1
0.5
3
0
0
700
m 4l (GeV)
500
400
300
(a)
(b)
200
100
80
900
H
ZZ*
4l
m H = 125.09 GeV
68% C.L.
95% C.L.
best fit
SM
Z
Z
Fig. 6.12 (a) Distribution of the four-lepton reconstructed invariant mass m 4l in the full mass
range, combining data from 2016 an 2017. Points with error bars represent the data and stacked
histograms represent expected distributions of the signal and background processes. The ZZ (∗)
backgrounds are normalized to the SM expectation, the Z + X background to the estimation from
data. (b) Result of the 2D likelihood scan for the μ(ggH, ttH, bbH, tqH) and μ(VBF,VH) signalstrength modifiers
CMS has studied the coupling properties using 77.4 fb −1 of pp. collision data
recorded at
√ s = 13TeV [41]. The four-lepton invariant mass distribution is
illustrated in Fig. 6.12a. The signal strength is measured to be μ = 1.06 +0.15 –0.13
at m H = 125.09 GeV, the combined ATLAS and CMS measurement of the Higgs
boson mass [42]. The result of a 2D likelihood scan of the signal strengths for the