

780
D. Froidevaux
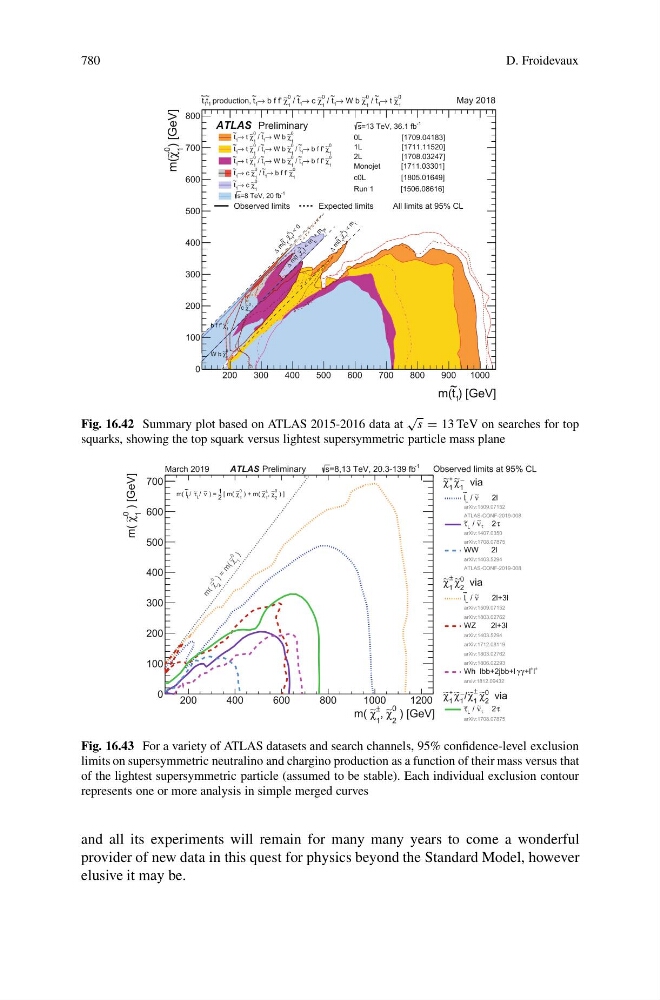
Fig. 16.42 Summary plot based on ATLAS 2015-2016 data at
√
s = 13 TeV on searches for top
squarks, showing the top squark versus lightest supersymmetric particle mass plane
Fig. 16.43 For a variety of ATLAS datasets and search channels, 95% confidence-level exclusion
limits on supersymmetric neutralino and chargino production as a function of their mass versus that
of the lightest supersymmetric particle (assumed to be stable). Each individual exclusion contour
represents one or more analysis in simple merged curves
and all its experiments will remain for many many years to come a wonderful
provider of new data in this quest for physics beyond the Standard Model, however
elusive it may be.