

762
D. Froidevaux
Muon system only
Inner Tracker only
Full system
Δp/p
10
–1
1
10
–2
10
–3
10
3
10
2
10
p [GeV/c]
0.0<η<0.2
Muon system only
Inner Tracker only
Full system
Δp/p
10
–1
10
–2
10
–3
10
3
10
2
10
p [GeV/c]
1.8<η<2.0
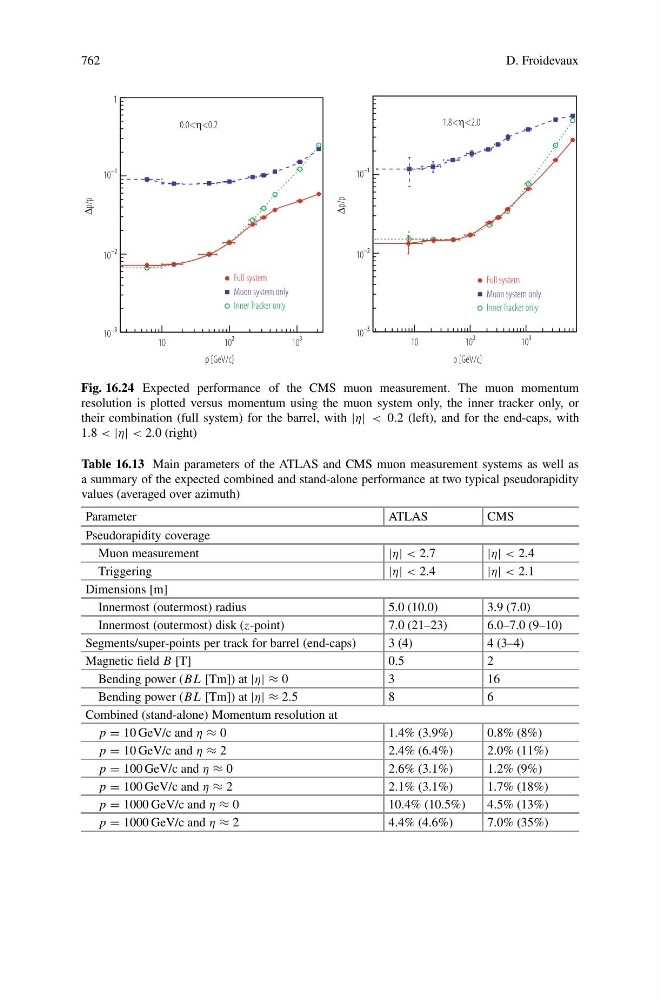
Fig. 16.24 Expected performance of the CMS muon measurement. The muon momentum
resolution is plotted versus momentum using the muon system only, the inner tracker only, or
their combination (full system) for the barrel, with |η| < 0.2 (left), and for the end-caps, with
1.8 < |η| < 2.0 (right)
Table 16.13 Main parameters of the ATLAS and CMS muon measurement systems as well as
a summary of the expected combined and stand-alone performance at two typical pseudorapidity
values (averaged over azimuth)
Parameter
ATLAS
CMS
Pseudorapidity coverage
Muon measurement
|η| < 2.7
|η| < 2.4
Triggering
|η| < 2.4
|η| < 2.1
Dimensions [m]
Innermost (outermost) radius
5.0 (10.0)
3.9 (7.0)
Innermost (outermost) disk (z-point)
7.0 (21–23)
6.0–7.0 (9–10)
Segments/super-points per track for barrel (end-caps)
3 (4)
4 (3–4)
Magnetic field B [T]
0.5
2
Bending power (BL [Tm]) at |η| ≈ 0
3
16
Bending power (BL [Tm]) at |η| ≈ 2.5
8
6
Combined (stand-alone) Momentum resolution at
p = 10 GeV/c and η ≈ 0
1.4% (3.9%)
0.8% (8%)
p = 10 GeV/c and η ≈ 2
2.4% (6.4%)
2.0% (11%)
p = 100 GeV/c and η ≈ 0
2.6% (3.1%)
1.2% (9%)
p = 100 GeV/c and η ≈ 2
2.1% (3.1%)
1.7% (18%)
p = 1000 GeV/c and η ≈ 0
10.4% (10.5%)
4.5% (13%)
p = 1000 GeV/c and η ≈ 2
4.4% (4.6%)
7.0% (35%)