

16 Integration of Detectors into a Large Experiment: Examples from ATLAS. . .
759
to the signal dependence on temperature. The LAr signal has a temperature
dependence of −2% per degree: the temperature monitoring system in the barrel
sensitive volume should therefore track temperature changes above ±0.15 ◦ ,
which is the expected dispersion from the heat influx of 2.5 kW per cryostat.
In CMS, the temperature control requirements are even more demanding, since
the temperature dependence of a crystal and its readout is about −4.3% per
degree for a heat load of 2 W per channel or 160 kW total. The very sophisticated
cooling scheme implemented in the super-modules has demonstrated the ability
to maintain the temperature to better than ±0.05 ◦ and thereby to meet these
stringent requirements. Time-dependent effects related to radiation damage of the
CMS crystals will have to be monitored continuously with a stable and precise
laser system.
16.8.2.2 Hadronic Calorimetry
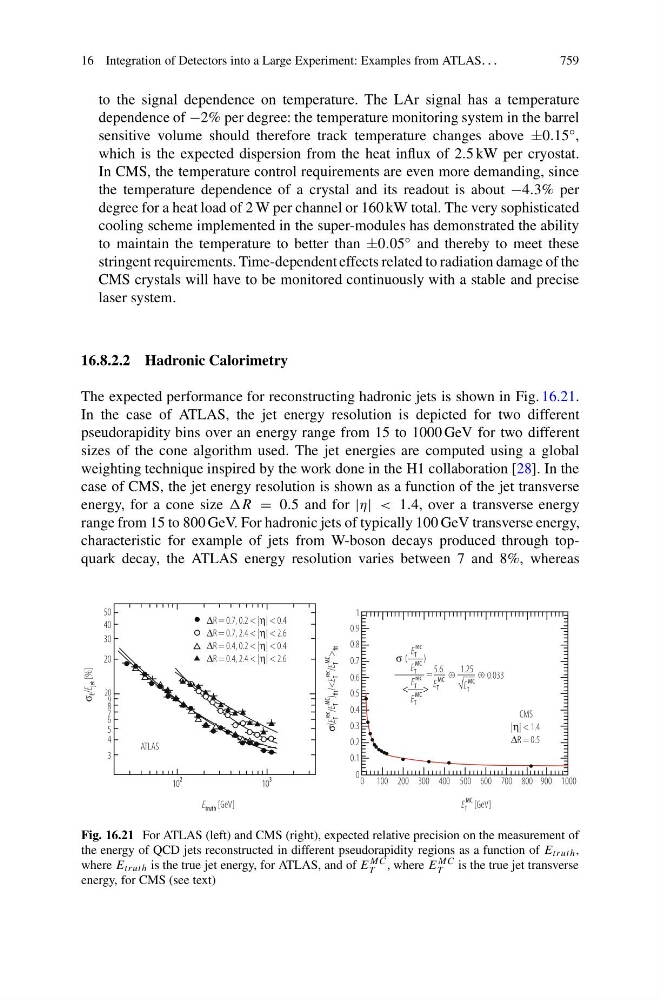
The expected performance for reconstructing hadronic jets is shown in Fig. 16.21.
In the case of ATLAS, the jet energy resolution is depicted for two different
pseudorapidity bins over an energy range from 15 to 1000 GeV for two different
sizes of the cone algorithm used. The jet energies are computed using a global
weighting technique inspired by the work done in the H1 collaboration [28]. In the
case of CMS, the jet energy resolution is shown as a function of the jet transverse
energy, for a cone size R = 0.5 and for |η| < 1.4, over a transverse energy
range from 15 to 800 GeV. For hadronic jets of typically 100 GeV transverse energy,
characteristic for example of jets from W-boson decays produced through topquark decay, the ATLAS energy resolution varies between 7 and 8%, whereas
50
1
0.9
0.8
0.7
0.6
0.5
0.4
0.3
0.2
0.1
0 0 100
10
2
10
3
200
σ (
)
300
5.6
1.25
400 500 600 700 800 900 1000
σ
E /E
jet [%]
σ(E
T
rec
/E
T
MC
)
fit /
rec
/E
T
MC
>
fit
40
30
ATLAS
ΔR = 0.7, 0.2 < |η| < 0.4
ΔR = 0.7, 2.4 < |η| < 2.6
ΔR = 0.4, 0.2 < |η| < 0.4
ΔR = 0.4, 2.4 < |η| < 2.6
CMS
|η| < 1.4
ΔR = 0.5
=
+
+ 0.033
20
20
8
9
7
6
5
3
4
E truth [GeV]
E T
MC [GeV]
E T
rec
E T
MC
E T
MC
E T
rec
E T
MC
< >
√E T
MC
Fig. 16.21 For ATLAS (left) and CMS (right), expected relative precision on the measurement of
the energy of QCD jets reconstructed in different pseudorapidity regions as a function of E truth ,
where E truth is the true jet energy, for ATLAS, and of E
MC
T , where E
MC
T
is the true jet transverse
energy, for CMS (see text)