

602
R. Frühwirth et al.
Table 13.3 List of different tracking iterations used after the Pixel Tracker upgrade with the
corresponding seeding configuration used and target tracks [157]
Iteration
Step name
Seeding
Target tracks
0
Initial
Pixel quadruplets
Prompt, high p T
1
LowPtQuad
Pixel quadruplets
Prompt, low p T
2
HighPtTriplet
Pixel triplets
Prompt, high p T recovery
3
LowPtTriplet
Pixel triplets
Prompt, low p T
4
DetachedQuad
Pixel quadruplets
From b hadron decay, r ≤ 5 cm
5
DetachedTriplet
Pixel triplets
From b hadron decay, r ≤ 10 cm
6
MixedTriplet
Pixel+strip triplets
Displaced, r ≤ 7 cm
7
PixelLess
Inner strip pairs
Displaced, r ≤ 25 cm
8
TobTec
Outer strip pairs
Displaced, r ≤ 60 cm
9
JetCore
Pixel pairs in jets
High-p T jets
10
Muon inside-out
Muon-tagged tracks
Muons
11
Muon outside-in
Standalone muons
Muons
η
Simulated track
3
−
2
−
1
−
0
1
2
3
Tracking efficiency
0
0.1
0.2
0.3
0.4
0.5
0.6
0.7
0.8
0.9
1
2017 (CA) no PU
=35
〉
PU
〈
2017 (CA)
=50
〉
PU
〈
2017 (CA)
=70
〉
PU
〈
2017 (CA)
13 TeV
CMS Simulation preliminary
event tracks
t
t
< 3.5 cm
0
d
> 0.9 GeV,
T
p
(GeV)
T
Simulated track p
1
−
10
1
10
2
10
Tracking efficiency
0
0.1
0.2
0.3
0.4
0.5
0.6
0.7
0.8
0.9
1
Initial
+HighPtTriplet
+LowPtQuad
+LowPtTriplet
+DetachedQuad
+DetachedTriplet
+MixedTriplet
+PixelLess
+TobTec
+JetCore
+Muon inside-out
+Muon outside-in
13 TeV
CMS Simulation preliminary
=35)
〉
PU
〈
event tracks (
t
t
< 3.5 cm
0
d
| < 2.5,
η
|
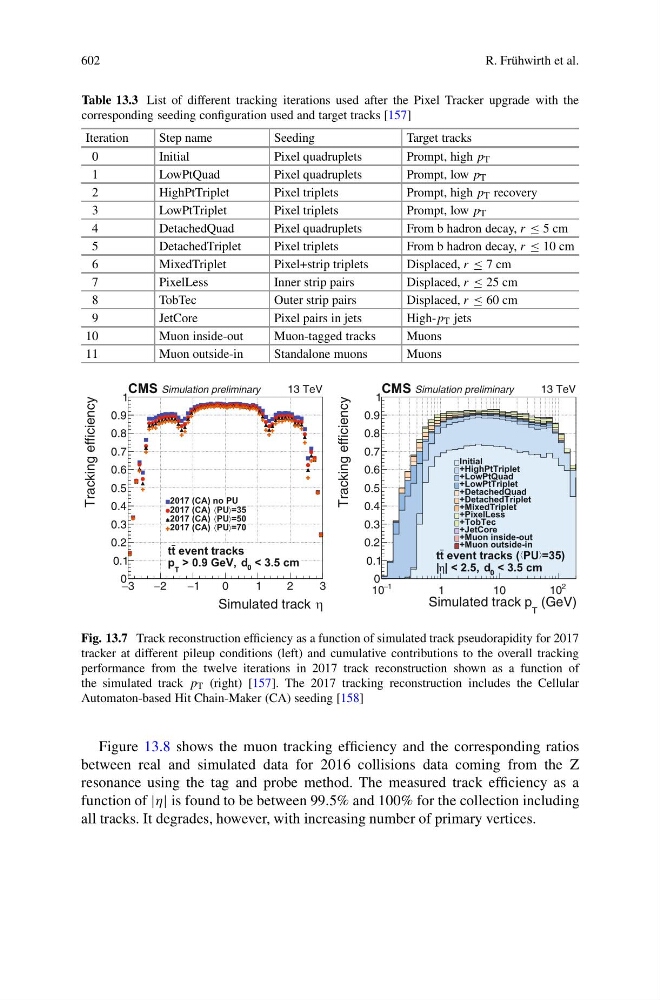
Fig. 13.7 Track reconstruction efficiency as a function of simulated track pseudorapidity for 2017
tracker at different pileup conditions (left) and cumulative contributions to the overall tracking
performance from the twelve iterations in 2017 track reconstruction shown as a function of
the simulated track p T (right) [157]. The 2017 tracking reconstruction includes the Cellular
Automaton-based Hit Chain-Maker (CA) seeding [158]
Figure 13.8 shows the muon tracking efficiency and the corresponding ratios
between real and simulated data for 2016 collisions data coming from the Z
resonance using the tag and probe method. The measured track efficiency as a
function of |η| is found to be between 99.5% and 100% for the collection including
all tracks. It degrades, however, with increasing number of primary vertices.
R. Frühwirth et al.
Table 13.3 List of different tracking iterations used after the Pixel Tracker upgrade with the
corresponding seeding configuration used and target tracks [157]
Iteration
Step name
Seeding
Target tracks
0
Initial
Pixel quadruplets
Prompt, high p T
1
LowPtQuad
Pixel quadruplets
Prompt, low p T
2
HighPtTriplet
Pixel triplets
Prompt, high p T recovery
3
LowPtTriplet
Pixel triplets
Prompt, low p T
4
DetachedQuad
Pixel quadruplets
From b hadron decay, r ≤ 5 cm
5
DetachedTriplet
Pixel triplets
From b hadron decay, r ≤ 10 cm
6
MixedTriplet
Pixel+strip triplets
Displaced, r ≤ 7 cm
7
PixelLess
Inner strip pairs
Displaced, r ≤ 25 cm
8
TobTec
Outer strip pairs
Displaced, r ≤ 60 cm
9
JetCore
Pixel pairs in jets
High-p T jets
10
Muon inside-out
Muon-tagged tracks
Muons
11
Muon outside-in
Standalone muons
Muons
η
Simulated track
3
−
2
−
1
−
0
1
2
3
Tracking efficiency
0
0.1
0.2
0.3
0.4
0.5
0.6
0.7
0.8
0.9
1
2017 (CA) no PU
=35
〉
PU
〈
2017 (CA)
=50
〉
PU
〈
2017 (CA)
=70
〉
PU
〈
2017 (CA)
13 TeV
CMS Simulation preliminary
event tracks
t
t
< 3.5 cm
0
d
> 0.9 GeV,
T
p
(GeV)
T
Simulated track p
1
−
10
1
10
2
10
Tracking efficiency
0
0.1
0.2
0.3
0.4
0.5
0.6
0.7
0.8
0.9
1
Initial
+HighPtTriplet
+LowPtQuad
+LowPtTriplet
+DetachedQuad
+DetachedTriplet
+MixedTriplet
+PixelLess
+TobTec
+JetCore
+Muon inside-out
+Muon outside-in
13 TeV
CMS Simulation preliminary
=35)
〉
PU
〈
event tracks (
t
t
< 3.5 cm
0
d
| < 2.5,
η
|
Fig. 13.7 Track reconstruction efficiency as a function of simulated track pseudorapidity for 2017
tracker at different pileup conditions (left) and cumulative contributions to the overall tracking
performance from the twelve iterations in 2017 track reconstruction shown as a function of
the simulated track p T (right) [157]. The 2017 tracking reconstruction includes the Cellular
Automaton-based Hit Chain-Maker (CA) seeding [158]
Figure 13.8 shows the muon tracking efficiency and the corresponding ratios
between real and simulated data for 2016 collisions data coming from the Z
resonance using the tag and probe method. The measured track efficiency as a
function of |η| is found to be between 99.5% and 100% for the collection including
all tracks. It degrades, however, with increasing number of primary vertices.