

38
H. Bichsel and H. Schindler
distribution of n e are described by the average energy W required to produce an
electron-ion (electron-hole) pair,
n e =
T
W
,
(2.40)
and the Fano factor F [94],
σ
2
= =(n − −n)
2
= F e
(2.41)
respectively. Both W and F are largely determined by the relative importance of
ionising and non-ionising inelastic collisions, the latter including e.g. excitations
or phonon scattering. If the cross sections for these processes are known, the
distribution of n e can be calculated using detailed Monte Carlo simulations. An
example is the MAGBOLTZ program [95, 96], which includes the relevant cross
sections for many commonly used detection gases. Inelastic cross sections of delta
electrons in solids can be calculated based on the dielectric formalism discussed in
Sect. 2.3.1 (in its non-relativistic version), often making using of optical data and
a suitable model of the q-dependence of Im (−1/ε (q, E)) as, for instance, in the
Penn algorithm described in Ref. [97].
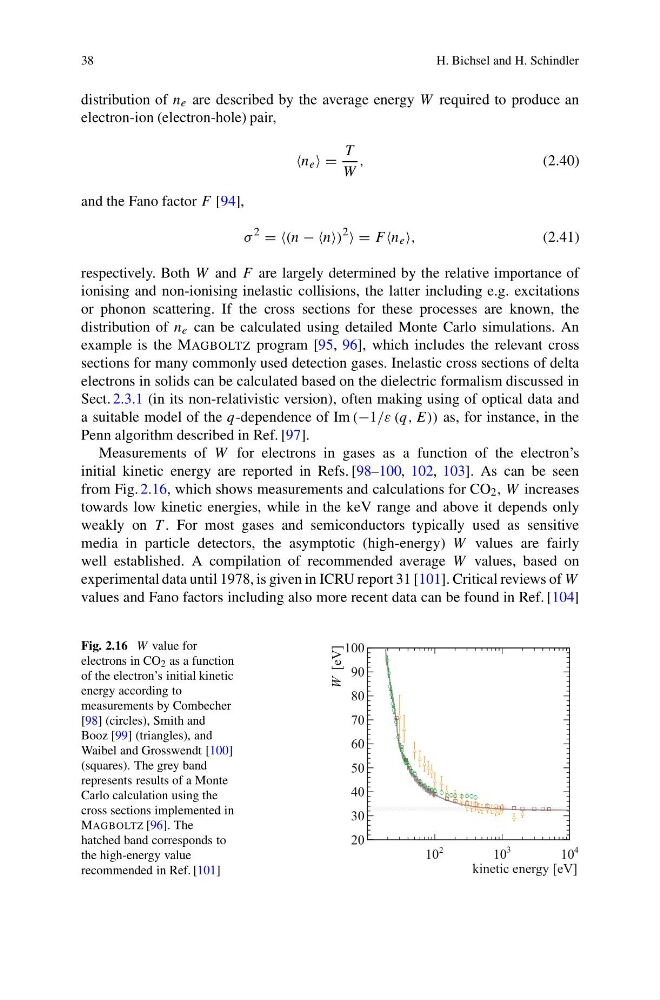
Measurements of W for electrons in gases as a function of the electron’s
initial kinetic energy are reported in Refs. [98–100, 102, 103]. As can be seen
from Fig. 2.16, which shows measurements and calculations for CO 2 , W increases
towards low kinetic energies, while in the keV range and above it depends only
weakly on T . For most gases and semiconductors typically used as sensitive
media in particle detectors, the asymptotic (high-energy) W values are fairly
well established. A compilation of recommended average W values, based on
experimental data until 1978, is given in ICRU report 31 [101]. Critical reviews of W
values and Fano factors including also more recent data can be found in Ref. [104]
Fig. 2.16 W value for
electrons in CO 2 as a function
of the electron’s initial kinetic
energy according to
measurements by Combecher
[98] (circles), Smith and
Booz [99] (triangles), and
Waibel and Grosswendt [100]
(squares). The grey band
represents results of a Monte
Carlo calculation using the
cross sections implemented in
MAGBOLTZ [96]. The
hatched band corresponds to
the high-energy value
recommended in Ref. [101]
2
10
3
10
4
10
kinetic energy [eV]
20
30
40
50
60
70
80
90
100
W [eV]
H. Bichsel and H. Schindler
distribution of n e are described by the average energy W required to produce an
electron-ion (electron-hole) pair,
n e =
T
W
,
(2.40)
and the Fano factor F [94],
σ
2
= =(n − −n)
2
= F e
(2.41)
respectively. Both W and F are largely determined by the relative importance of
ionising and non-ionising inelastic collisions, the latter including e.g. excitations
or phonon scattering. If the cross sections for these processes are known, the
distribution of n e can be calculated using detailed Monte Carlo simulations. An
example is the MAGBOLTZ program [95, 96], which includes the relevant cross
sections for many commonly used detection gases. Inelastic cross sections of delta
electrons in solids can be calculated based on the dielectric formalism discussed in
Sect. 2.3.1 (in its non-relativistic version), often making using of optical data and
a suitable model of the q-dependence of Im (−1/ε (q, E)) as, for instance, in the
Penn algorithm described in Ref. [97].
Measurements of W for electrons in gases as a function of the electron’s
initial kinetic energy are reported in Refs. [98–100, 102, 103]. As can be seen
from Fig. 2.16, which shows measurements and calculations for CO 2 , W increases
towards low kinetic energies, while in the keV range and above it depends only
weakly on T . For most gases and semiconductors typically used as sensitive
media in particle detectors, the asymptotic (high-energy) W values are fairly
well established. A compilation of recommended average W values, based on
experimental data until 1978, is given in ICRU report 31 [101]. Critical reviews of W
values and Fano factors including also more recent data can be found in Ref. [104]
Fig. 2.16 W value for
electrons in CO 2 as a function
of the electron’s initial kinetic
energy according to
measurements by Combecher
[98] (circles), Smith and
Booz [99] (triangles), and
Waibel and Grosswendt [100]
(squares). The grey band
represents results of a Monte
Carlo calculation using the
cross sections implemented in
MAGBOLTZ [96]. The
hatched band corresponds to
the high-energy value
recommended in Ref. [101]
2
10
3
10
4
10
kinetic energy [eV]
20
30
40
50
60
70
80
90
100
W [eV]