

4 Gaseous Detectors
117
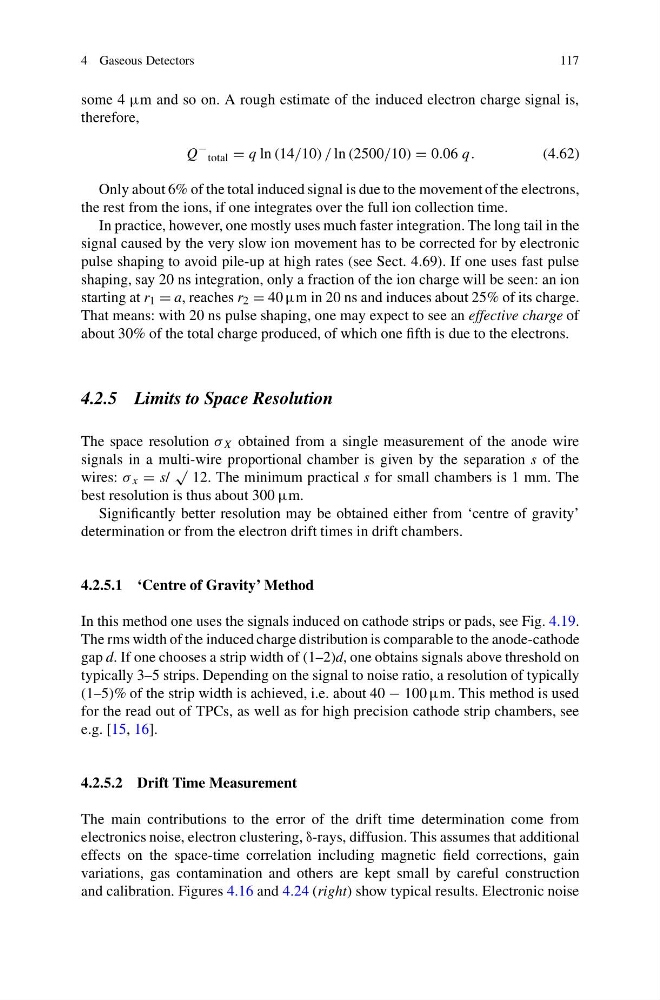
some 4 μm and so on. A rough estimate of the induced electron charge signal is,
therefore,
Q
−
total = q ln (14/10) / ln (2500/10) = 0.06 q.
(4.62)
Only about 6% of the total induced signal is due to the movement of the electrons,
the rest from the ions, if one integrates over the full ion collection time.
In practice, however, one mostly uses much faster integration. The long tail in the
signal caused by the very slow ion movement has to be corrected for by electronic
pulse shaping to avoid pile-up at high rates (see Sect. 4.69). If one uses fast pulse
shaping, say 20 ns integration, only a fraction of the ion charge will be seen: an ion
starting at r 1 = a, reaches r 2 = 40 μm in 20 ns and induces about 25% of its charge.
That means: with 20 ns pulse shaping, one may expect to see an effective charge of
about 30% of the total charge produced, of which one fifth is due to the electrons.
4.2.5 Limits to Space Resolution
The space resolution σ X obtained from a single measurement of the anode wire
signals in a multi-wire proportional chamber is given by the separation s of the
wires: σ x = s/
√
12. The minimum practical s for small chambers is 1 mm. The
best resolution is thus about 300 μm.
Significantly better resolution may be obtained either from ‘centre of gravity’
determination or from the electron drift times in drift chambers.
4.2.5.1 ‘Centre of Gravity’ Method
In this method one uses the signals induced on cathode strips or pads, see Fig. 4.19.
The rms width of the induced charge distribution is comparable to the anode-cathode
gap d. If one chooses a strip width of (1–2)d, one obtains signals above threshold on
typically 3–5 strips. Depending on the signal to noise ratio, a resolution of typically
(1–5)% of the strip width is achieved, i.e. about 40 − 100 μm. This method is used
for the read out of TPCs, as well as for high precision cathode strip chambers, see
e.g. [15, 16].
4.2.5.2 Drift Time Measurement
The main contributions to the error of the drift time determination come from
electronics noise, electron clustering, δ-rays, diffusion. This assumes that additional
effects on the space-time correlation including magnetic field corrections, gain
variations, gas contamination and others are kept small by careful construction
and calibration. Figures 4.16 and 4.24 (right) show typical results. Electronic noise
117
some 4 μm and so on. A rough estimate of the induced electron charge signal is,
therefore,
Q
−
total = q ln (14/10) / ln (2500/10) = 0.06 q.
(4.62)
Only about 6% of the total induced signal is due to the movement of the electrons,
the rest from the ions, if one integrates over the full ion collection time.
In practice, however, one mostly uses much faster integration. The long tail in the
signal caused by the very slow ion movement has to be corrected for by electronic
pulse shaping to avoid pile-up at high rates (see Sect. 4.69). If one uses fast pulse
shaping, say 20 ns integration, only a fraction of the ion charge will be seen: an ion
starting at r 1 = a, reaches r 2 = 40 μm in 20 ns and induces about 25% of its charge.
That means: with 20 ns pulse shaping, one may expect to see an effective charge of
about 30% of the total charge produced, of which one fifth is due to the electrons.
4.2.5 Limits to Space Resolution
The space resolution σ X obtained from a single measurement of the anode wire
signals in a multi-wire proportional chamber is given by the separation s of the
wires: σ x = s/
√
12. The minimum practical s for small chambers is 1 mm. The
best resolution is thus about 300 μm.
Significantly better resolution may be obtained either from ‘centre of gravity’
determination or from the electron drift times in drift chambers.
4.2.5.1 ‘Centre of Gravity’ Method
In this method one uses the signals induced on cathode strips or pads, see Fig. 4.19.
The rms width of the induced charge distribution is comparable to the anode-cathode
gap d. If one chooses a strip width of (1–2)d, one obtains signals above threshold on
typically 3–5 strips. Depending on the signal to noise ratio, a resolution of typically
(1–5)% of the strip width is achieved, i.e. about 40 − 100 μm. This method is used
for the read out of TPCs, as well as for high precision cathode strip chambers, see
e.g. [15, 16].
4.2.5.2 Drift Time Measurement
The main contributions to the error of the drift time determination come from
electronics noise, electron clustering, δ-rays, diffusion. This assumes that additional
effects on the space-time correlation including magnetic field corrections, gain
variations, gas contamination and others are kept small by careful construction
and calibration. Figures 4.16 and 4.24 (right) show typical results. Electronic noise