

3.2 Numerical Results
As highlighted in the previous section, the main objective of our integrated last mile
3D bin packing problem is to minimize the operational cost while efficiently using
the vehicles’ capacity and consequently minimizing the number of empty vehicles
circulating in the network. To fulfill such a purpose, in the case study, we created two
scenarios for comparison. In the first scenario, two logistics service companies serve
their individual last mile networks by their own fleet of trucks, while in the second
scenario, these two companies pool the truck resource and collaborate to make the
last mile delivery with the consolidated customer demand. In this case study, we
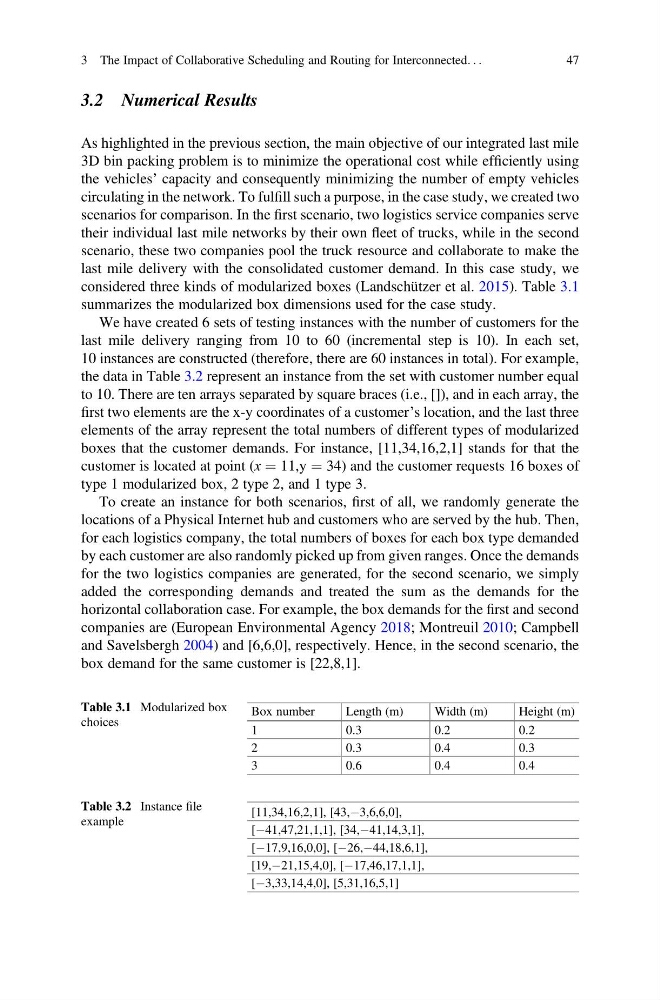
considered three kinds of modularized boxes (Landschützer et al. 2015). Table 3.1
summarizes the modularized box dimensions used for the case study.
We have created 6 sets of testing instances with the number of customers for the
last mile delivery ranging from 10 to 60 (incremental step is 10). In each set,
10 instances are constructed (therefore, there are 60 instances in total). For example,
the data in Table 3.2 represent an instance from the set with customer number equal
to 10. There are ten arrays separated by square braces (i.e., []), and in each array, the
first two elements are the x-y coordinates of a customer’s location, and the last three
elements of the array represent the total numbers of different types of modularized
boxes that the customer demands. For instance, [11,34,16,2,1] stands for that the
customer is located at point (x ¼ 11,y ¼ 34) and the customer requests 16 boxes of
type 1 modularized box, 2 type 2, and 1 type 3.
To create an instance for both scenarios, first of all, we randomly generate the
locations of a Physical Internet hub and customers who are served by the hub. Then,
for each logistics company, the total numbers of boxes for each box type demanded
by each customer are also randomly picked up from given ranges. Once the demands
for the two logistics companies are generated, for the second scenario, we simply
added the corresponding demands and treated the sum as the demands for the
horizontal collaboration case. For example, the box demands for the first and second
companies are (European Environmental Agency 2018; Montreuil 2010; Campbell
and Savelsbergh 2004) and [6,6,0], respectively. Hence, in the second scenario, the
box demand for the same customer is [22,8,1].
Table 3.1 Modularized box
choices
Box number
Length (m)
Width (m)
Height (m)
1
0.3
0.2
0.2
2
0.3
0.4
0.3
3
0.6
0.4
0.4
Table 3.2 Instance file
example
[11,34,16,2,1], [43,À3,6,6,0],
[À41,47,21,1,1], [34,À41,14,3,1],
[À17,9,16,0,0], [À26,À44,18,6,1],
[19,À21,15,4,0], [À17,46,17,1,1],
[À3,33,14,4,0], [5,31,16,5,1]
3 The Impact of Collaborative Scheduling and Routing for Interconnected. . .
47
As highlighted in the previous section, the main objective of our integrated last mile
3D bin packing problem is to minimize the operational cost while efficiently using
the vehicles’ capacity and consequently minimizing the number of empty vehicles
circulating in the network. To fulfill such a purpose, in the case study, we created two
scenarios for comparison. In the first scenario, two logistics service companies serve
their individual last mile networks by their own fleet of trucks, while in the second
scenario, these two companies pool the truck resource and collaborate to make the
last mile delivery with the consolidated customer demand. In this case study, we
considered three kinds of modularized boxes (Landschützer et al. 2015). Table 3.1
summarizes the modularized box dimensions used for the case study.
We have created 6 sets of testing instances with the number of customers for the
last mile delivery ranging from 10 to 60 (incremental step is 10). In each set,
10 instances are constructed (therefore, there are 60 instances in total). For example,
the data in Table 3.2 represent an instance from the set with customer number equal
to 10. There are ten arrays separated by square braces (i.e., []), and in each array, the
first two elements are the x-y coordinates of a customer’s location, and the last three
elements of the array represent the total numbers of different types of modularized
boxes that the customer demands. For instance, [11,34,16,2,1] stands for that the
customer is located at point (x ¼ 11,y ¼ 34) and the customer requests 16 boxes of
type 1 modularized box, 2 type 2, and 1 type 3.
To create an instance for both scenarios, first of all, we randomly generate the
locations of a Physical Internet hub and customers who are served by the hub. Then,
for each logistics company, the total numbers of boxes for each box type demanded
by each customer are also randomly picked up from given ranges. Once the demands
for the two logistics companies are generated, for the second scenario, we simply
added the corresponding demands and treated the sum as the demands for the
horizontal collaboration case. For example, the box demands for the first and second
companies are (European Environmental Agency 2018; Montreuil 2010; Campbell
and Savelsbergh 2004) and [6,6,0], respectively. Hence, in the second scenario, the
box demand for the same customer is [22,8,1].
Table 3.1 Modularized box
choices
Box number
Length (m)
Width (m)
Height (m)
1
0.3
0.2
0.2
2
0.3
0.4
0.3
3
0.6
0.4
0.4
Table 3.2 Instance file
example
[11,34,16,2,1], [43,À3,6,6,0],
[À41,47,21,1,1], [34,À41,14,3,1],
[À17,9,16,0,0], [À26,À44,18,6,1],
[19,À21,15,4,0], [À17,46,17,1,1],
[À3,33,14,4,0], [5,31,16,5,1]
3 The Impact of Collaborative Scheduling and Routing for Interconnected. . .
47