

2.7 Experimental Section
77
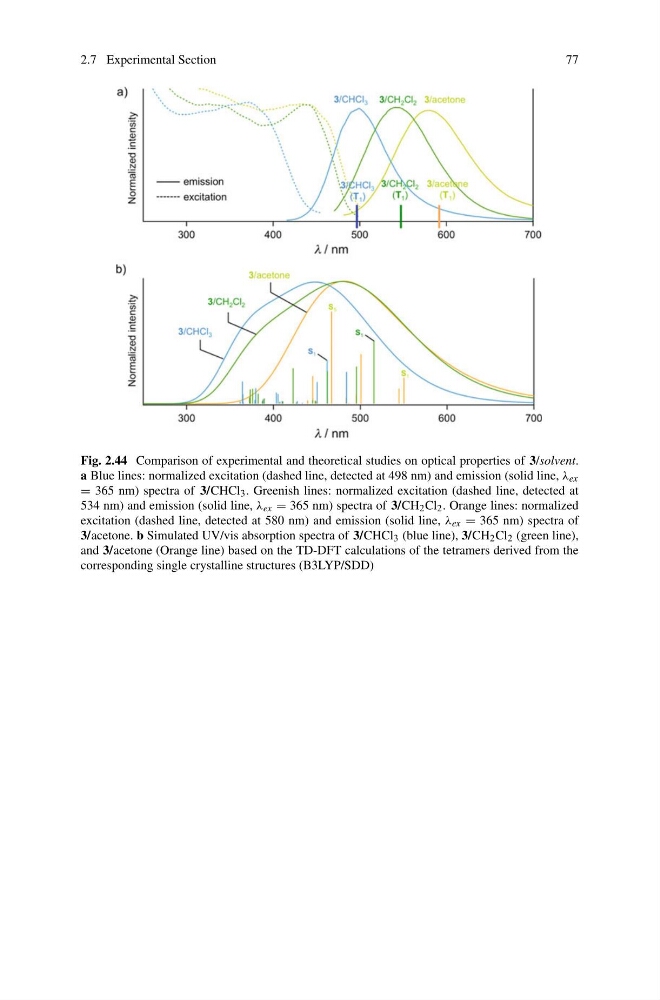
Fig. 2.44 Comparison of experimental and theoretical studies on optical properties of 3/solvent.
a Blue lines: normalized excitation (dashed line, detected at 498 nm) and emission (solid line, λ ex
= 365 nm) spectra of 3/CHCl 3 . Greenish lines: normalized excitation (dashed line, detected at
534 nm) and emission (solid line, λ ex = 365 nm) spectra of 3/CH 2 Cl 2 . Orange lines: normalized
excitation (dashed line, detected at 580 nm) and emission (solid line, λ ex = 365 nm) spectra of
3/acetone. b Simulated UV/vis absorption spectra of 3/CHCl 3 (blue line), 3/CH 2 Cl 2 (green line),
and 3/acetone (Orange line) based on the TD-DFT calculations of the tetramers derived from the
corresponding single crystalline structures (B3LYP/SDD)
77
Fig. 2.44 Comparison of experimental and theoretical studies on optical properties of 3/solvent.
a Blue lines: normalized excitation (dashed line, detected at 498 nm) and emission (solid line, λ ex
= 365 nm) spectra of 3/CHCl 3 . Greenish lines: normalized excitation (dashed line, detected at
534 nm) and emission (solid line, λ ex = 365 nm) spectra of 3/CH 2 Cl 2 . Orange lines: normalized
excitation (dashed line, detected at 580 nm) and emission (solid line, λ ex = 365 nm) spectra of
3/acetone. b Simulated UV/vis absorption spectra of 3/CHCl 3 (blue line), 3/CH 2 Cl 2 (green line),
and 3/acetone (Orange line) based on the TD-DFT calculations of the tetramers derived from the
corresponding single crystalline structures (B3LYP/SDD)