

152
5 Mechanical-Stimulation-Triggered and Solvent-Vapor-Induced …
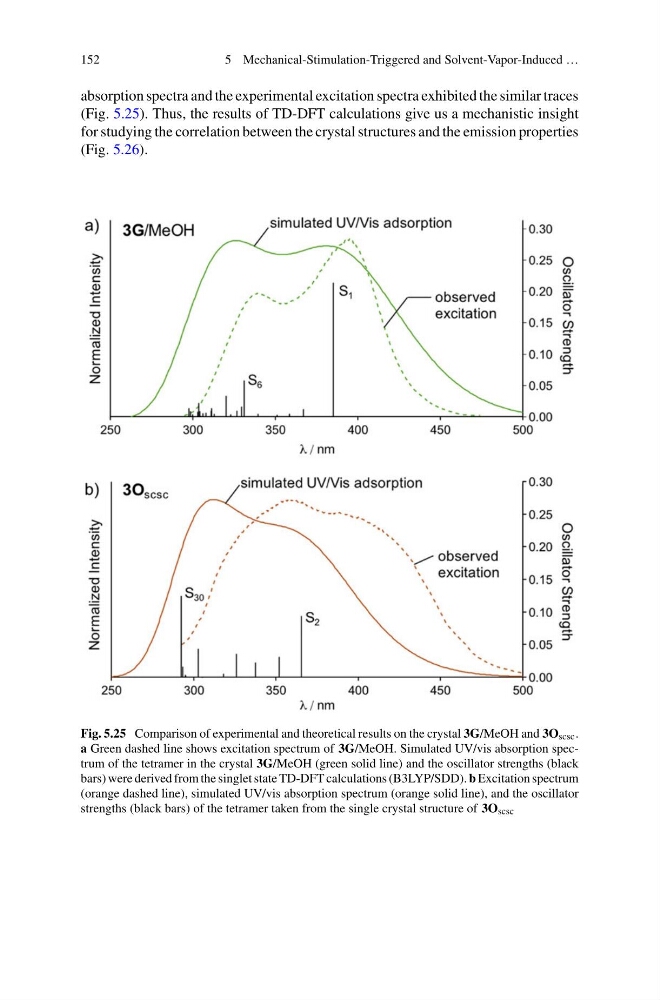
absorption spectra and the experimental excitation spectra exhibited the similar traces
(Fig. 5.25). Thus, the results of TD-DFT calculations give us a mechanistic insight
for studying the correlation between the crystal structures and the emission properties
(Fig. 5.26).
Fig. 5.25 Comparison of experimental and theoretical results on the crystal 3G/MeOH and 3O scsc .
a Green dashed line shows excitation spectrum of 3G/MeOH. Simulated UV/vis absorption spectrum of the tetramer in the crystal 3G/MeOH (green solid line) and the oscillator strengths (black
bars) were derived from the singlet state TD-DFT calculations (B3LYP/SDD). b Excitation spectrum
(orange dashed line), simulated UV/vis absorption spectrum (orange solid line), and the oscillator
strengths (black bars) of the tetramer taken from the single crystal structure of 3O scsc
5 Mechanical-Stimulation-Triggered and Solvent-Vapor-Induced …
absorption spectra and the experimental excitation spectra exhibited the similar traces
(Fig. 5.25). Thus, the results of TD-DFT calculations give us a mechanistic insight
for studying the correlation between the crystal structures and the emission properties
(Fig. 5.26).
Fig. 5.25 Comparison of experimental and theoretical results on the crystal 3G/MeOH and 3O scsc .
a Green dashed line shows excitation spectrum of 3G/MeOH. Simulated UV/vis absorption spectrum of the tetramer in the crystal 3G/MeOH (green solid line) and the oscillator strengths (black
bars) were derived from the singlet state TD-DFT calculations (B3LYP/SDD). b Excitation spectrum
(orange dashed line), simulated UV/vis absorption spectrum (orange solid line), and the oscillator
strengths (black bars) of the tetramer taken from the single crystal structure of 3O scsc