

5.4 Studies on Luminescence Properties
135
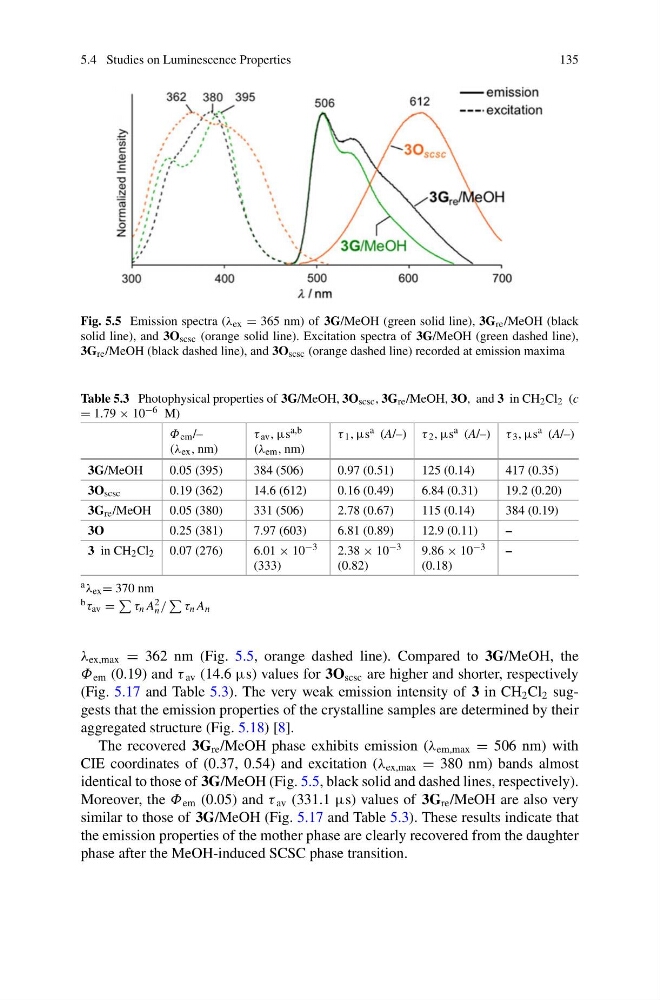
Fig. 5.5 Emission spectra (λ ex = 365 nm) of 3G/MeOH (green solid line), 3G re /MeOH (black
solid line), and 3O scsc (orange solid line). Excitation spectra of 3G/MeOH (green dashed line),
3G re /MeOH (black dashed line), and 3O scsc (orange dashed line) recorded at emission maxima
Table 5.3 Photophysical properties of 3G/MeOH, 3O scsc , 3G re /MeOH, 3O, and 3 in CH 2 Cl 2 (c
= 1.79 × 10 −6 M)
Φ em /–
(λ ex , nm)
τ av , μs a,b
(λ em , nm)
τ 1 , μs a (A/–) τ 2 , μs a (A/–) τ 3 , μs a (A/–)
3G/MeOH
0.05 (395)
384 (506)
0.97 (0.51)
125 (0.14)
417 (0.35)
3O scsc
0.19 (362)
14.6 (612)
0.16 (0.49)
6.84 (0.31)
19.2 (0.20)
3G re /MeOH 0.05 (380)
331 (506)
2.78 (0.67)
115 (0.14)
384 (0.19)
3O
0.25 (381)
7.97 (603)
6.81 (0.89)
12.9 (0.11)
–
3 in CH 2 Cl 2 0.07 (276)
6.01 × 10 −3
(333)
2.38 × 10 −3
(0.82)
9.86 × 10 −3
(0.18)
–
a λ ex = 370 nm
b τ av =
τ n A 2
n /
τ n A n
λ ex,max = 362 nm (Fig. 5.5, orange dashed line). Compared to 3G/MeOH, the
Φ em (0.19) and τ av (14.6 μs) values for 3O scsc are higher and shorter, respectively
(Fig. 5.17 and Table 5.3). The very weak emission intensity of 3 in CH 2 Cl 2 suggests that the emission properties of the crystalline samples are determined by their
aggregated structure (Fig. 5.18) [8].
The recovered 3G re /MeOH phase exhibits emission (λ em,max = 506 nm) with
CIE coordinates of (0.37, 0.54) and excitation (λ ex,max = 380 nm) bands almost
identical to those of 3G/MeOH (Fig. 5.5, black solid and dashed lines, respectively).
Moreover, the Φ em (0.05) and τ av (331.1 μs) values of 3G re /MeOH are also very
similar to those of 3G/MeOH (Fig. 5.17 and Table 5.3). These results indicate that
the emission properties of the mother phase are clearly recovered from the daughter
phase after the MeOH-induced SCSC phase transition.
135
Fig. 5.5 Emission spectra (λ ex = 365 nm) of 3G/MeOH (green solid line), 3G re /MeOH (black
solid line), and 3O scsc (orange solid line). Excitation spectra of 3G/MeOH (green dashed line),
3G re /MeOH (black dashed line), and 3O scsc (orange dashed line) recorded at emission maxima
Table 5.3 Photophysical properties of 3G/MeOH, 3O scsc , 3G re /MeOH, 3O, and 3 in CH 2 Cl 2 (c
= 1.79 × 10 −6 M)
Φ em /–
(λ ex , nm)
τ av , μs a,b
(λ em , nm)
τ 1 , μs a (A/–) τ 2 , μs a (A/–) τ 3 , μs a (A/–)
3G/MeOH
0.05 (395)
384 (506)
0.97 (0.51)
125 (0.14)
417 (0.35)
3O scsc
0.19 (362)
14.6 (612)
0.16 (0.49)
6.84 (0.31)
19.2 (0.20)
3G re /MeOH 0.05 (380)
331 (506)
2.78 (0.67)
115 (0.14)
384 (0.19)
3O
0.25 (381)
7.97 (603)
6.81 (0.89)
12.9 (0.11)
–
3 in CH 2 Cl 2 0.07 (276)
6.01 × 10 −3
(333)
2.38 × 10 −3
(0.82)
9.86 × 10 −3
(0.18)
–
a λ ex = 370 nm
b τ av =
τ n A 2
n /
τ n A n
λ ex,max = 362 nm (Fig. 5.5, orange dashed line). Compared to 3G/MeOH, the
Φ em (0.19) and τ av (14.6 μs) values for 3O scsc are higher and shorter, respectively
(Fig. 5.17 and Table 5.3). The very weak emission intensity of 3 in CH 2 Cl 2 suggests that the emission properties of the crystalline samples are determined by their
aggregated structure (Fig. 5.18) [8].
The recovered 3G re /MeOH phase exhibits emission (λ em,max = 506 nm) with
CIE coordinates of (0.37, 0.54) and excitation (λ ex,max = 380 nm) bands almost
identical to those of 3G/MeOH (Fig. 5.5, black solid and dashed lines, respectively).
Moreover, the Φ em (0.05) and τ av (331.1 μs) values of 3G re /MeOH are also very
similar to those of 3G/MeOH (Fig. 5.17 and Table 5.3). These results indicate that
the emission properties of the mother phase are clearly recovered from the daughter
phase after the MeOH-induced SCSC phase transition.