

5.3 Single Crystal X-ray Diffraction Analyses
133
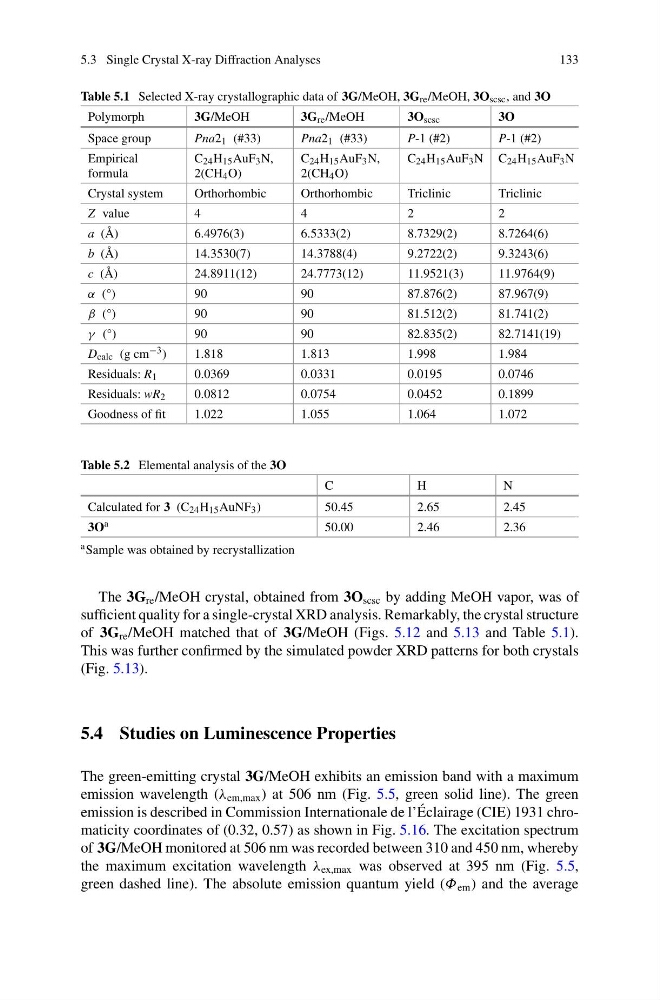
Table 5.1 Selected X-ray crystallographic data of 3G/MeOH, 3G re /MeOH, 3O scsc , and 3O
Polymorph
3G/MeOH
3G re /MeOH
3O scsc
3O
Space group
Pna2 1 (#33)
Pna2 1 (#33)
P-1 (#2)
P-1 (#2)
Empirical
formula
C 24 H 15 AuF 3 N,
2(CH 4 O)
C 24 H 15 AuF 3 N,
2(CH 4 O)
C 24 H 15 AuF 3 N C 24 H 15 AuF 3 N
Crystal system
Orthorhombic
Orthorhombic
Triclinic
Triclinic
Z value
4
4
2
2
a (Å)
6.4976(3)
6.5333(2)
8.7329(2)
8.7264(6)
b (Å)
14.3530(7)
14.3788(4)
9.2722(2)
9.3243(6)
c (Å)
24.8911(12)
24.7773(12)
11.9521(3)
11.9764(9)
α (°)
90
90
87.876(2)
87.967(9)
β (°)
90
90
81.512(2)
81.741(2)
γ (°)
90
90
82.835(2)
82.7141(19)
D calc (g cm −3 )
1.818
1.813
1.998
1.984
Residuals: R 1
0.0369
0.0331
0.0195
0.0746
Residuals: wR 2
0.0812
0.0754
0.0452
0.1899
Goodness of fit
1.022
1.055
1.064
1.072
Table 5.2 Elemental analysis of the 3O
C
H
N
Calculated for 3 (C 24 H 15 AuNF 3 )
50.45
2.65
2.45
3O a
50.00
2.46
2.36
a Sample was obtained by recrystallization
The 3G re /MeOH crystal, obtained from 3O scsc by adding MeOH vapor, was of
sufficient quality for a single-crystal XRD analysis. Remarkably, the crystal structure
of 3G re /MeOH matched that of 3G/MeOH (Figs. 5.12 and 5.13 and Table 5.1).
This was further confirmed by the simulated powder XRD patterns for both crystals
(Fig. 5.13).
5.4 Studies on Luminescence Properties
The green-emitting crystal 3G/MeOH exhibits an emission band with a maximum
emission wavelength (λ em,max ) at 506 nm (Fig. 5.5, green solid line). The green
emission is described in Commission Internationale de l’Éclairage (CIE) 1931 chromaticity coordinates of (0.32, 0.57) as shown in Fig. 5.16. The excitation spectrum
of 3G/MeOH monitored at 506 nm was recorded between 310 and 450 nm, whereby
the maximum excitation wavelength λ ex,max was observed at 395 nm (Fig. 5.5,
green dashed line). The absolute emission quantum yield (Φ em ) and the average
133
Table 5.1 Selected X-ray crystallographic data of 3G/MeOH, 3G re /MeOH, 3O scsc , and 3O
Polymorph
3G/MeOH
3G re /MeOH
3O scsc
3O
Space group
Pna2 1 (#33)
Pna2 1 (#33)
P-1 (#2)
P-1 (#2)
Empirical
formula
C 24 H 15 AuF 3 N,
2(CH 4 O)
C 24 H 15 AuF 3 N,
2(CH 4 O)
C 24 H 15 AuF 3 N C 24 H 15 AuF 3 N
Crystal system
Orthorhombic
Orthorhombic
Triclinic
Triclinic
Z value
4
4
2
2
a (Å)
6.4976(3)
6.5333(2)
8.7329(2)
8.7264(6)
b (Å)
14.3530(7)
14.3788(4)
9.2722(2)
9.3243(6)
c (Å)
24.8911(12)
24.7773(12)
11.9521(3)
11.9764(9)
α (°)
90
90
87.876(2)
87.967(9)
β (°)
90
90
81.512(2)
81.741(2)
γ (°)
90
90
82.835(2)
82.7141(19)
D calc (g cm −3 )
1.818
1.813
1.998
1.984
Residuals: R 1
0.0369
0.0331
0.0195
0.0746
Residuals: wR 2
0.0812
0.0754
0.0452
0.1899
Goodness of fit
1.022
1.055
1.064
1.072
Table 5.2 Elemental analysis of the 3O
C
H
N
Calculated for 3 (C 24 H 15 AuNF 3 )
50.45
2.65
2.45
3O a
50.00
2.46
2.36
a Sample was obtained by recrystallization
The 3G re /MeOH crystal, obtained from 3O scsc by adding MeOH vapor, was of
sufficient quality for a single-crystal XRD analysis. Remarkably, the crystal structure
of 3G re /MeOH matched that of 3G/MeOH (Figs. 5.12 and 5.13 and Table 5.1).
This was further confirmed by the simulated powder XRD patterns for both crystals
(Fig. 5.13).
5.4 Studies on Luminescence Properties
The green-emitting crystal 3G/MeOH exhibits an emission band with a maximum
emission wavelength (λ em,max ) at 506 nm (Fig. 5.5, green solid line). The green
emission is described in Commission Internationale de l’Éclairage (CIE) 1931 chromaticity coordinates of (0.32, 0.57) as shown in Fig. 5.16. The excitation spectrum
of 3G/MeOH monitored at 506 nm was recorded between 310 and 450 nm, whereby
the maximum excitation wavelength λ ex,max was observed at 395 nm (Fig. 5.5,
green dashed line). The absolute emission quantum yield (Φ em ) and the average