

116
4 Mechano-Responsive Luminescence via Crystal-to-Crystal Phase …
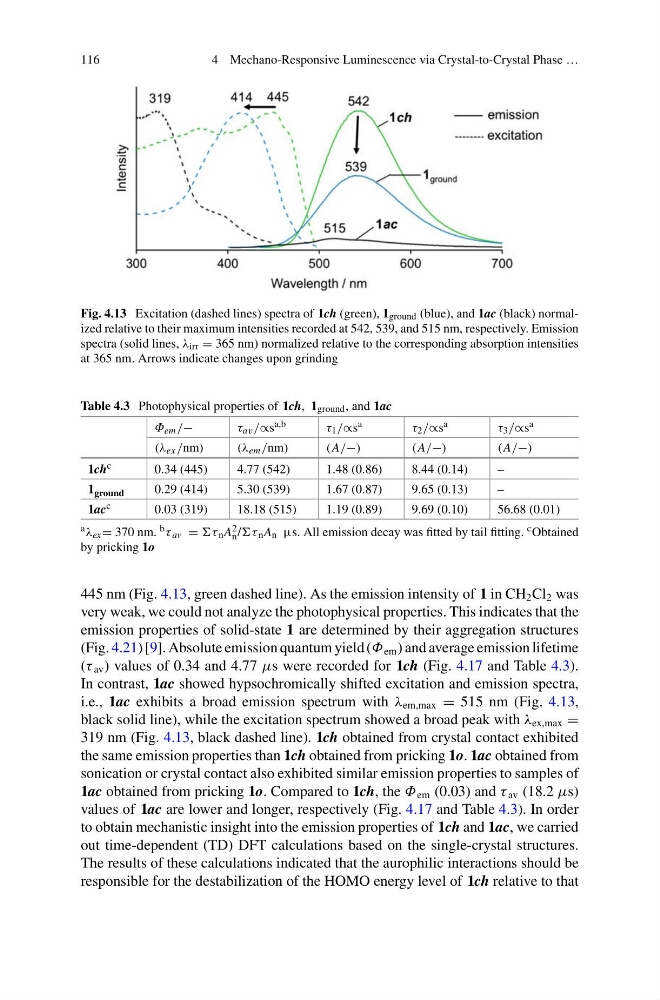
Fig. 4.13 Excitation (dashed lines) spectra of 1ch (green), 1 ground (blue), and 1ac (black) normalized relative to their maximum intensities recorded at 542, 539, and 515 nm, respectively. Emission
spectra (solid lines, λ irr = 365 nm) normalized relative to the corresponding absorption intensities
at 365 nm. Arrows indicate changes upon grinding
Table 4.3 Photophysical properties of 1ch, 1 ground , and 1ac
Φ em /−
τ av /∝s a,b
τ 1 /∝s a
τ 2 /∝s a
τ 3 /∝s a
(λ ex /nm)
(λ em /nm)
(A/−)
(A/−)
(A/−)
1ch c
0.34 (445)
4.77 (542)
1.48 (0.86)
8.44 (0.14)
–
1 ground
0.29 (414)
5.30 (539)
1.67 (0.87)
9.65 (0.13)
–
1ac c
0.03 (319)
18.18 (515)
1.19 (0.89)
9.69 (0.10)
56.68 (0.01)
a λ ex = 370 nm. b τ av = τ n A 2
n /τ n A n μs. All emission decay was fitted by tail fitting. c Obtained
by pricking 1o
445 nm (Fig. 4.13, green dashed line). As the emission intensity of 1 in CH 2 Cl 2 was
very weak, we could not analyze the photophysical properties. This indicates that the
emission properties of solid-state 1 are determined by their aggregation structures
(Fig. 4.21) [9]. Absolute emission quantum yield (Φ em ) and average emission lifetime
(τ av ) values of 0.34 and 4.77 μs were recorded for 1ch (Fig. 4.17 and Table 4.3).
In contrast, 1ac showed hypsochromically shifted excitation and emission spectra,
i.e., 1ac exhibits a broad emission spectrum with λ em,max = 515 nm (Fig. 4.13,
black solid line), while the excitation spectrum showed a broad peak with λ ex,max =
319 nm (Fig. 4.13, black dashed line). 1ch obtained from crystal contact exhibited
the same emission properties than 1ch obtained from pricking 1o. 1ac obtained from
sonication or crystal contact also exhibited similar emission properties to samples of
1ac obtained from pricking 1o. Compared to 1ch, the Φ em (0.03) and τ av (18.2 μs)
values of 1ac are lower and longer, respectively (Fig. 4.17 and Table 4.3). In order
to obtain mechanistic insight into the emission properties of 1ch and 1ac, we carried
out time-dependent (TD) DFT calculations based on the single-crystal structures.
The results of these calculations indicated that the aurophilic interactions should be
responsible for the destabilization of the HOMO energy level of 1ch relative to that
4 Mechano-Responsive Luminescence via Crystal-to-Crystal Phase …
Fig. 4.13 Excitation (dashed lines) spectra of 1ch (green), 1 ground (blue), and 1ac (black) normalized relative to their maximum intensities recorded at 542, 539, and 515 nm, respectively. Emission
spectra (solid lines, λ irr = 365 nm) normalized relative to the corresponding absorption intensities
at 365 nm. Arrows indicate changes upon grinding
Table 4.3 Photophysical properties of 1ch, 1 ground , and 1ac
Φ em /−
τ av /∝s a,b
τ 1 /∝s a
τ 2 /∝s a
τ 3 /∝s a
(λ ex /nm)
(λ em /nm)
(A/−)
(A/−)
(A/−)
1ch c
0.34 (445)
4.77 (542)
1.48 (0.86)
8.44 (0.14)
–
1 ground
0.29 (414)
5.30 (539)
1.67 (0.87)
9.65 (0.13)
–
1ac c
0.03 (319)
18.18 (515)
1.19 (0.89)
9.69 (0.10)
56.68 (0.01)
a λ ex = 370 nm. b τ av = τ n A 2
n /τ n A n μs. All emission decay was fitted by tail fitting. c Obtained
by pricking 1o
445 nm (Fig. 4.13, green dashed line). As the emission intensity of 1 in CH 2 Cl 2 was
very weak, we could not analyze the photophysical properties. This indicates that the
emission properties of solid-state 1 are determined by their aggregation structures
(Fig. 4.21) [9]. Absolute emission quantum yield (Φ em ) and average emission lifetime
(τ av ) values of 0.34 and 4.77 μs were recorded for 1ch (Fig. 4.17 and Table 4.3).
In contrast, 1ac showed hypsochromically shifted excitation and emission spectra,
i.e., 1ac exhibits a broad emission spectrum with λ em,max = 515 nm (Fig. 4.13,
black solid line), while the excitation spectrum showed a broad peak with λ ex,max =
319 nm (Fig. 4.13, black dashed line). 1ch obtained from crystal contact exhibited
the same emission properties than 1ch obtained from pricking 1o. 1ac obtained from
sonication or crystal contact also exhibited similar emission properties to samples of
1ac obtained from pricking 1o. Compared to 1ch, the Φ em (0.03) and τ av (18.2 μs)
values of 1ac are lower and longer, respectively (Fig. 4.17 and Table 4.3). In order
to obtain mechanistic insight into the emission properties of 1ch and 1ac, we carried
out time-dependent (TD) DFT calculations based on the single-crystal structures.
The results of these calculations indicated that the aurophilic interactions should be
responsible for the destabilization of the HOMO energy level of 1ch relative to that