

4.5 Thermal Analyses
115
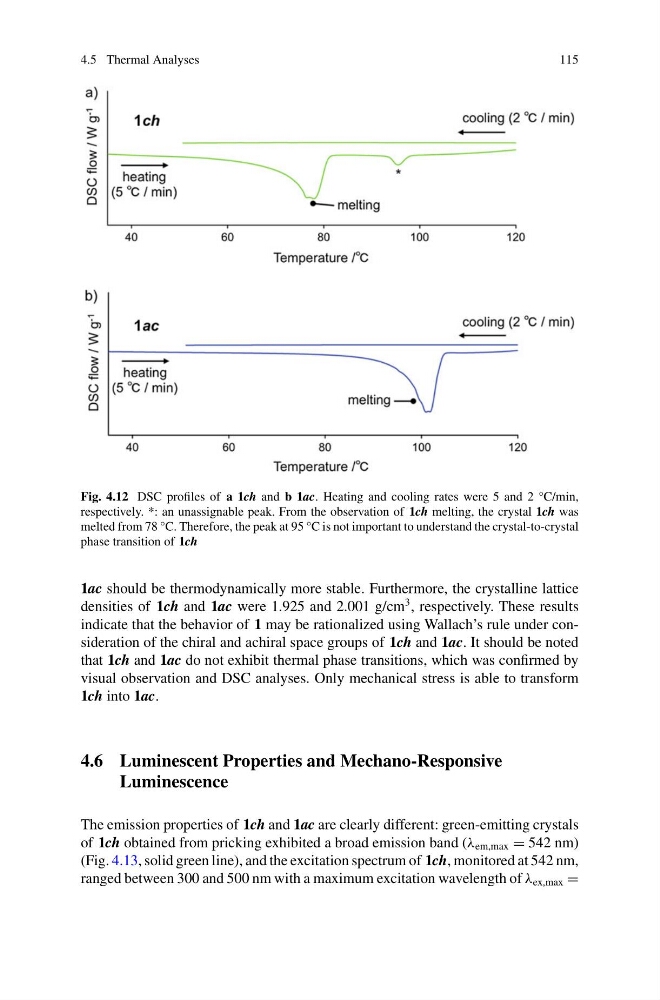
Fig. 4.12 DSC profiles of a 1ch and b 1ac. Heating and cooling rates were 5 and 2 °C/min,
respectively. *: an unassignable peak. From the observation of 1ch melting, the crystal 1ch was
melted from 78 °C. Therefore, the peak at 95 °C is not important to understand the crystal-to-crystal
phase transition of 1ch
1ac should be thermodynamically more stable. Furthermore, the crystalline lattice
densities of 1ch and 1ac were 1.925 and 2.001 g/cm
3 , respectively. These results
indicate that the behavior of 1 may be rationalized using Wallach’s rule under consideration of the chiral and achiral space groups of 1ch and 1ac. It should be noted
that 1ch and 1ac do not exhibit thermal phase transitions, which was confirmed by
visual observation and DSC analyses. Only mechanical stress is able to transform
1ch into 1ac.
4.6 Luminescent Properties and Mechano-Responsive
Luminescence
The emission properties of 1ch and 1ac are clearly different: green-emitting crystals
of 1ch obtained from pricking exhibited a broad emission band (λ em,max = 542 nm)
(Fig. 4.13, solid green line), and the excitation spectrum of 1ch, monitored at 542 nm,
ranged between 300 and 500 nm with a maximum excitation wavelength of λ ex,max =
115
Fig. 4.12 DSC profiles of a 1ch and b 1ac. Heating and cooling rates were 5 and 2 °C/min,
respectively. *: an unassignable peak. From the observation of 1ch melting, the crystal 1ch was
melted from 78 °C. Therefore, the peak at 95 °C is not important to understand the crystal-to-crystal
phase transition of 1ch
1ac should be thermodynamically more stable. Furthermore, the crystalline lattice
densities of 1ch and 1ac were 1.925 and 2.001 g/cm
3 , respectively. These results
indicate that the behavior of 1 may be rationalized using Wallach’s rule under consideration of the chiral and achiral space groups of 1ch and 1ac. It should be noted
that 1ch and 1ac do not exhibit thermal phase transitions, which was confirmed by
visual observation and DSC analyses. Only mechanical stress is able to transform
1ch into 1ac.
4.6 Luminescent Properties and Mechano-Responsive
Luminescence
The emission properties of 1ch and 1ac are clearly different: green-emitting crystals
of 1ch obtained from pricking exhibited a broad emission band (λ em,max = 542 nm)
(Fig. 4.13, solid green line), and the excitation spectrum of 1ch, monitored at 542 nm,
ranged between 300 and 500 nm with a maximum excitation wavelength of λ ex,max =