

364
Y. Kobayashi and H. Kobayashi
0
5
10
15
20
Normalized PL Intensity
Time (ns)
(a)
(b)
(c)
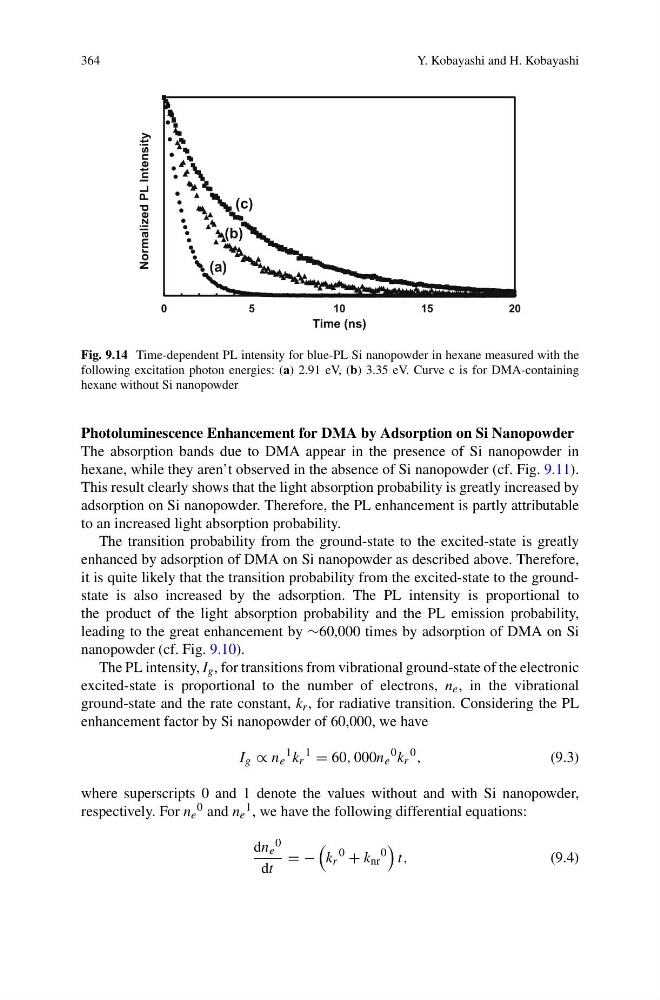
Fig. 9.14 Time-dependent PL intensity for blue-PL Si nanopowder in hexane measured with the
following excitation photon energies: (a) 2.91 eV, (b) 3.35 eV. Curve c is for DMA-containing
hexane without Si nanopowder
Photoluminescence Enhancement for DMA by Adsorption on Si Nanopowder
The absorption bands due to DMA appear in the presence of Si nanopowder in
hexane, while they aren’t observed in the absence of Si nanopowder (cf. Fig. 9.11).
This result clearly shows that the light absorption probability is greatly increased by
adsorption on Si nanopowder. Therefore, the PL enhancement is partly attributable
to an increased light absorption probability.
The transition probability from the ground-state to the excited-state is greatly
enhanced by adsorption of DMA on Si nanopowder as described above. Therefore,
it is quite likely that the transition probability from the excited-state to the groundstate is also increased by the adsorption. The PL intensity is proportional to
the product of the light absorption probability and the PL emission probability,
leading to the great enhancement by ∼60,000 times by adsorption of DMA on Si
nanopowder (cf. Fig. 9.10).
The PL intensity, I g , for transitions from vibrational ground-state of the electronic
excited-state is proportional to the number of electrons, n e , in the vibrational
ground-state and the rate constant, k r , for radiative transition. Considering the PL
enhancement factor by Si nanopowder of 60,000, we have
I g ∝ n e
1 k r
1
= 60, 000n e
0 k r
0 ,
(9.3)
where superscripts 0 and 1 denote the values without and with Si nanopowder,
respectively. For n e
0 and n e
1 , we have the following differential equations:
dn e
0
dt
= −
k r
0
+ k nr
0
t,
(9.4)
Y. Kobayashi and H. Kobayashi
0
5
10
15
20
Normalized PL Intensity
Time (ns)
(a)
(b)
(c)
Fig. 9.14 Time-dependent PL intensity for blue-PL Si nanopowder in hexane measured with the
following excitation photon energies: (a) 2.91 eV, (b) 3.35 eV. Curve c is for DMA-containing
hexane without Si nanopowder
Photoluminescence Enhancement for DMA by Adsorption on Si Nanopowder
The absorption bands due to DMA appear in the presence of Si nanopowder in
hexane, while they aren’t observed in the absence of Si nanopowder (cf. Fig. 9.11).
This result clearly shows that the light absorption probability is greatly increased by
adsorption on Si nanopowder. Therefore, the PL enhancement is partly attributable
to an increased light absorption probability.
The transition probability from the ground-state to the excited-state is greatly
enhanced by adsorption of DMA on Si nanopowder as described above. Therefore,
it is quite likely that the transition probability from the excited-state to the groundstate is also increased by the adsorption. The PL intensity is proportional to
the product of the light absorption probability and the PL emission probability,
leading to the great enhancement by ∼60,000 times by adsorption of DMA on Si
nanopowder (cf. Fig. 9.10).
The PL intensity, I g , for transitions from vibrational ground-state of the electronic
excited-state is proportional to the number of electrons, n e , in the vibrational
ground-state and the rate constant, k r , for radiative transition. Considering the PL
enhancement factor by Si nanopowder of 60,000, we have
I g ∝ n e
1 k r
1
= 60, 000n e
0 k r
0 ,
(9.3)
where superscripts 0 and 1 denote the values without and with Si nanopowder,
respectively. For n e
0 and n e
1 , we have the following differential equations:
dn e
0
dt
= −
k r
0
+ k nr
0
t,
(9.4)