

138
S. Taioli
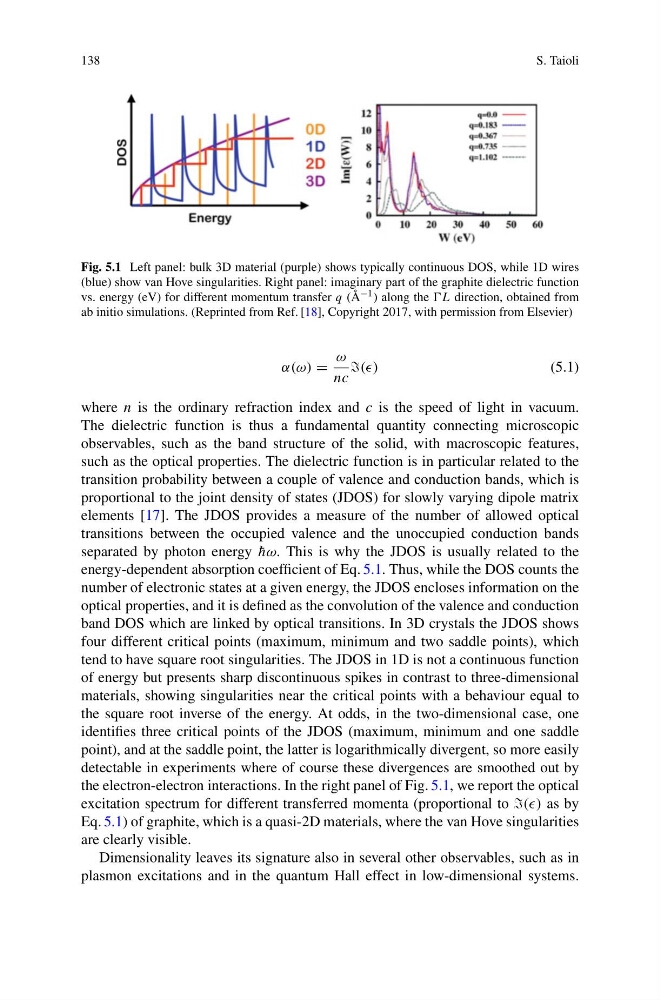
Fig. 5.1 Left panel: bulk 3D material (purple) shows typically continuous DOS, while 1D wires
(blue) show van Hove singularities. Right panel: imaginary part of the graphite dielectric function
vs. energy (eV) for different momentum transfer q (Å −1 ) along the L direction, obtained from
ab initio simulations. (Reprinted from Ref. [18], Copyright 2017, with permission from Elsevier)
α(ω) =
ω
nc
(()
(5.1)
where n is the ordinary refraction index and c is the speed of light in vacuum.
The dielectric function is thus a fundamental quantity connecting microscopic
observables, such as the band structure of the solid, with macroscopic features,
such as the optical properties. The dielectric function is in particular related to the
transition probability between a couple of valence and conduction bands, which is
proportional to the joint density of states (JDOS) for slowly varying dipole matrix
elements [17]. The JDOS provides a measure of the number of allowed optical
transitions between the occupied valence and the unoccupied conduction bands
separated by photon energy ¯
hω. This is why the JDOS is usually related to the
energy-dependent absorption coefficient of Eq. 5.1. Thus, while the DOS counts the
number of electronic states at a given energy, the JDOS encloses information on the
optical properties, and it is defined as the convolution of the valence and conduction
band DOS which are linked by optical transitions. In 3D crystals the JDOS shows
four different critical points (maximum, minimum and two saddle points), which
tend to have square root singularities. The JDOS in 1D is not a continuous function
of energy but presents sharp discontinuous spikes in contrast to three-dimensional
materials, showing singularities near the critical points with a behaviour equal to
the square root inverse of the energy. At odds, in the two-dimensional case, one
identifies three critical points of the JDOS (maximum, minimum and one saddle
point), and at the saddle point, the latter is logarithmically divergent, so more easily
detectable in experiments where of course these divergences are smoothed out by
the electron-electron interactions. In the right panel of Fig. 5.1, we report the optical
excitation spectrum for different transferred momenta (proportional to (() as by
Eq. 5.1) of graphite, which is a quasi-2D materials, where the van Hove singularities
are clearly visible.
Dimensionality leaves its signature also in several other observables, such as in
plasmon excitations and in the quantum Hall effect in low-dimensional systems.
S. Taioli
Fig. 5.1 Left panel: bulk 3D material (purple) shows typically continuous DOS, while 1D wires
(blue) show van Hove singularities. Right panel: imaginary part of the graphite dielectric function
vs. energy (eV) for different momentum transfer q (Å −1 ) along the L direction, obtained from
ab initio simulations. (Reprinted from Ref. [18], Copyright 2017, with permission from Elsevier)
α(ω) =
ω
nc
(()
(5.1)
where n is the ordinary refraction index and c is the speed of light in vacuum.
The dielectric function is thus a fundamental quantity connecting microscopic
observables, such as the band structure of the solid, with macroscopic features,
such as the optical properties. The dielectric function is in particular related to the
transition probability between a couple of valence and conduction bands, which is
proportional to the joint density of states (JDOS) for slowly varying dipole matrix
elements [17]. The JDOS provides a measure of the number of allowed optical
transitions between the occupied valence and the unoccupied conduction bands
separated by photon energy ¯
hω. This is why the JDOS is usually related to the
energy-dependent absorption coefficient of Eq. 5.1. Thus, while the DOS counts the
number of electronic states at a given energy, the JDOS encloses information on the
optical properties, and it is defined as the convolution of the valence and conduction
band DOS which are linked by optical transitions. In 3D crystals the JDOS shows
four different critical points (maximum, minimum and two saddle points), which
tend to have square root singularities. The JDOS in 1D is not a continuous function
of energy but presents sharp discontinuous spikes in contrast to three-dimensional
materials, showing singularities near the critical points with a behaviour equal to
the square root inverse of the energy. At odds, in the two-dimensional case, one
identifies three critical points of the JDOS (maximum, minimum and one saddle
point), and at the saddle point, the latter is logarithmically divergent, so more easily
detectable in experiments where of course these divergences are smoothed out by
the electron-electron interactions. In the right panel of Fig. 5.1, we report the optical
excitation spectrum for different transferred momenta (proportional to (() as by
Eq. 5.1) of graphite, which is a quasi-2D materials, where the van Hove singularities
are clearly visible.
Dimensionality leaves its signature also in several other observables, such as in
plasmon excitations and in the quantum Hall effect in low-dimensional systems.