

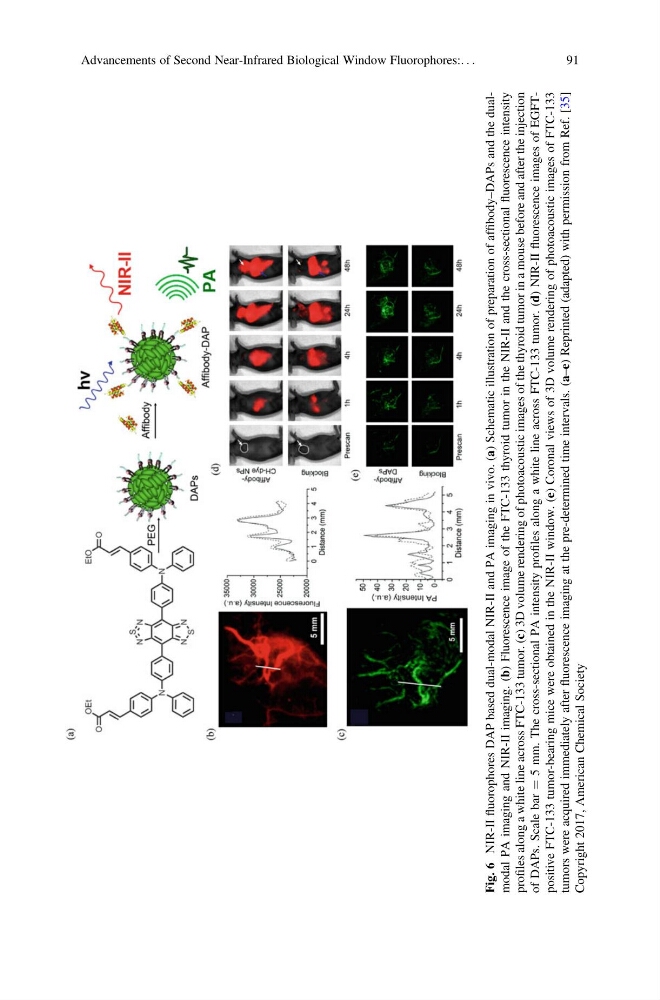
Fig. 6
NIR-II
fluorophores DAP based dual-modal NIR-II and PA imaging in vivo. (a) Schematic illustration of preparation of affibody–DAPs and the dualmodal PA imaging and NIR-II imaging. (b) Fluorescence image of the FTC-133 thyroid tumor in the NIR-II and the cross-sectional
fluorescence intensity
profiles along a white line across FTC-133 tumor. (c) 3D volume rendering of photoacoustic images of the thyroid tumor in a mouse before and after the injection
of DAPs. Scale bar
¼ 5 mm. The cross-sectional PA intensity profiles along a white line across FTC-133 tumor. (d) NIR-II
fluorescence images of EGFTpositive FTC-133 tumor-bearing mice were obtained in the NIR-II window. (e) Coronal views of 3D volume rendering of photoacoustic images of FTC-133
tumors were acquired immediately after
fluorescence imaging at the pre-determined time intervals. (a–e) Reprinted (adapted) with permission from Ref. [35]
Copyright 2017, American Chemical Society
Advancements of Second Near-Infrared Biological Window Fluorophores:. . .
91
NIR-II
fluorophores DAP based dual-modal NIR-II and PA imaging in vivo. (a) Schematic illustration of preparation of affibody–DAPs and the dualmodal PA imaging and NIR-II imaging. (b) Fluorescence image of the FTC-133 thyroid tumor in the NIR-II and the cross-sectional
fluorescence intensity
profiles along a white line across FTC-133 tumor. (c) 3D volume rendering of photoacoustic images of the thyroid tumor in a mouse before and after the injection
of DAPs. Scale bar
¼ 5 mm. The cross-sectional PA intensity profiles along a white line across FTC-133 tumor. (d) NIR-II
fluorescence images of EGFTpositive FTC-133 tumor-bearing mice were obtained in the NIR-II window. (e) Coronal views of 3D volume rendering of photoacoustic images of FTC-133
tumors were acquired immediately after
fluorescence imaging at the pre-determined time intervals. (a–e) Reprinted (adapted) with permission from Ref. [35]
Copyright 2017, American Chemical Society
Advancements of Second Near-Infrared Biological Window Fluorophores:. . .
91