

5 x 10 6
4 x 10 6
3 x 10 6
2 x 10 6
1 x 10 6
0
Pre-injection
autofluorescence
Color video
20 nm
1 cm
1 cm
N
Pre-injection
(autofluorescence)
30 sec
post-injection
4min
post-injection
Image-guided
resection
NIR fluorescence
Color-NIR merge
Color video 5 min
post-injection
NIR fluorescence 5 min
post-injection
500
1,000
800
600
400
200
0
600
700
900
800
Wavelength (nm)
Photoluminescence (arbitirary units)
Extinction coefficient (M –1
cm –1
)
1,000
a
c
d
b
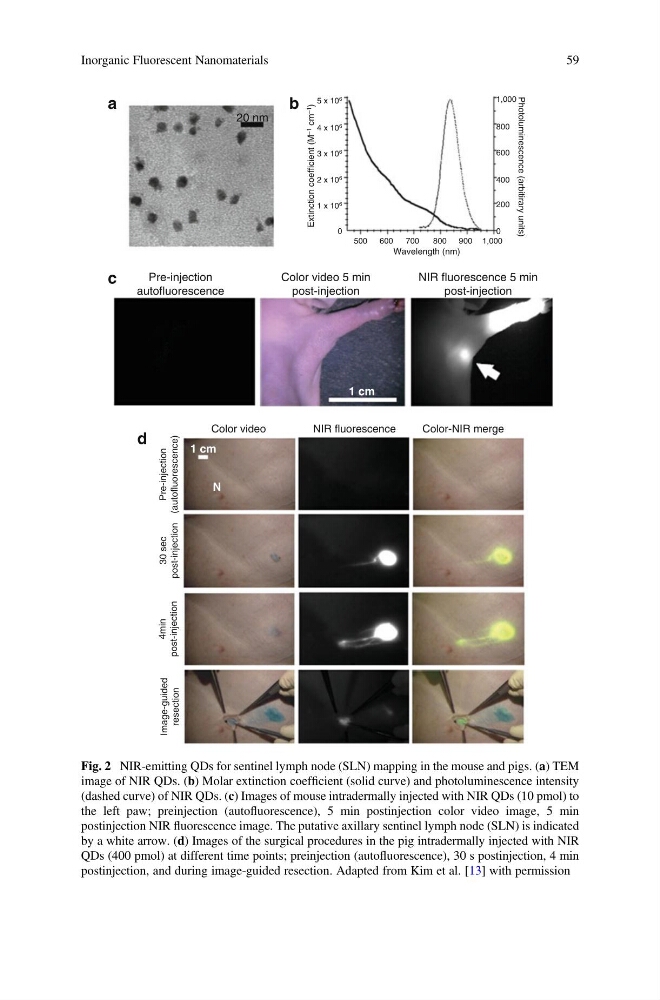
Fig. 2 NIR-emitting QDs for sentinel lymph node (SLN) mapping in the mouse and pigs. (a) TEM
image of NIR QDs. (b) Molar extinction coefficient (solid curve) and photoluminescence intensity
(dashed curve) of NIR QDs. (c) Images of mouse intradermally injected with NIR QDs (10 pmol) to
the left paw; preinjection (autofluorescence), 5 min postinjection color video image, 5 min
postinjection NIR fluorescence image. The putative axillary sentinel lymph node (SLN) is indicated
by a white arrow. (d) Images of the surgical procedures in the pig intradermally injected with NIR
QDs (400 pmol) at different time points; preinjection (autofluorescence), 30 s postinjection, 4 min
postinjection, and during image-guided resection. Adapted from Kim et al. [13] with permission
Inorganic Fluorescent Nanomaterials
59
4 x 10 6
3 x 10 6
2 x 10 6
1 x 10 6
0
Pre-injection
autofluorescence
Color video
20 nm
1 cm
1 cm
N
Pre-injection
(autofluorescence)
30 sec
post-injection
4min
post-injection
Image-guided
resection
NIR fluorescence
Color-NIR merge
Color video 5 min
post-injection
NIR fluorescence 5 min
post-injection
500
1,000
800
600
400
200
0
600
700
900
800
Wavelength (nm)
Photoluminescence (arbitirary units)
Extinction coefficient (M –1
cm –1
)
1,000
a
c
d
b
Fig. 2 NIR-emitting QDs for sentinel lymph node (SLN) mapping in the mouse and pigs. (a) TEM
image of NIR QDs. (b) Molar extinction coefficient (solid curve) and photoluminescence intensity
(dashed curve) of NIR QDs. (c) Images of mouse intradermally injected with NIR QDs (10 pmol) to
the left paw; preinjection (autofluorescence), 5 min postinjection color video image, 5 min
postinjection NIR fluorescence image. The putative axillary sentinel lymph node (SLN) is indicated
by a white arrow. (d) Images of the surgical procedures in the pig intradermally injected with NIR
QDs (400 pmol) at different time points; preinjection (autofluorescence), 30 s postinjection, 4 min
postinjection, and during image-guided resection. Adapted from Kim et al. [13] with permission
Inorganic Fluorescent Nanomaterials
59