

2.4
0
Concentration (#)
10
20
30
40
50
0
Concentration (#)
10
20
30
40
50
2.4
2.0
2.0
1.6
1.6
1.2
1.2
y (cm)
x (cm)
Au K
ab unpolarized 50 it
Au K
ab unpolarized 100 it
0.8
0.8
0.4
2.4
2.0
1.6
1.2
y (cm)
0.8
0.4
0.4
2.4
2.0
1.6
1.2
x (cm)
0.8
0.4
0
Concentration (#)
0
0.2
0.4
0.6
0.8
1
Concentration (#)
10
20
30
40
50
Au K
ab unpolarized 200 it
Au K
ab unpolarized FBP
2.4
2.0
1.6
1.2
y (cm)
0.8
0.4
2.4
2.0
1.6
1.2
x (cm)
0.8
0.4
2.4
2.0
1.6
1.2
y (cm)
0.8
0.4
2.4
2.0
1.6
1.2
x (cm)
0.8
0.4
2.4
0
Concentration (#)
10
20
30
40
50
0
Concentration (#)
10
20
30
40
50
2.4
2.0
2.0
1.6
1.6
1.2
1.2
y (cm)
x (cm)
Au K
ab polarized 50 it
Au K
ab polarized 100 it
0.8
0.8
0.4
2.4
2.0
1.6
1.2
y (cm)
0.8
0.4
0.4
2.4
2.0
1.6
1.2
x (cm)
0.8
0.4
0
Concentration (#)
0
0.2
0.4
0.6
0.8
1
Concentration (#)
10
20
30
40
50
Au K
ab polarized 200 it
Au K
ab polarized FBP
2.4
2.0
1.6
1.2
y (cm)
0.8
0.4
2.4
2.0
1.6
1.2
x (cm)
0.8
0.4
2.4
2.0
1.6
1.2
y (cm)
0.8
0.4
2.4
2.0
1.6
1.2
x (cm)
0.8
0.4
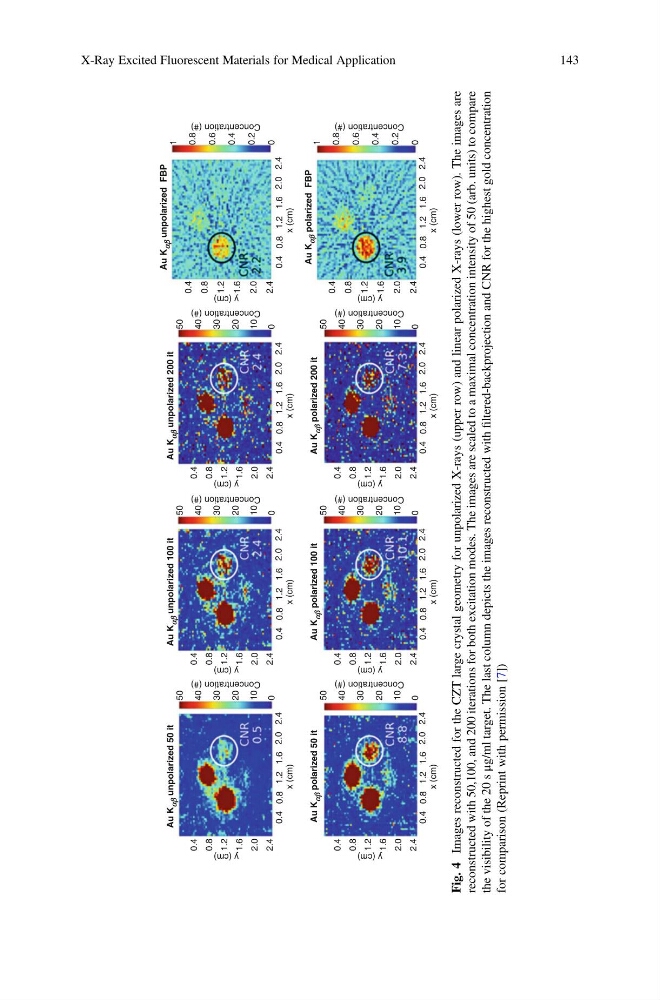
Fig. 4
Images reconstructed for the CZT large crystal geometry for unpolarized X-rays (upper row) and linear polarized X-rays (lower row). The images are
reconstructed with 50,100, and 200 iterations for both excitation modes. The images are scaled to a maximal concentration intensity of 50 (arb. units) to compare
the visibility of the 20 s
μg/ml target. The last column depicts the images reconstructed with
filtered-backprojection and CNR for the highest gold concentration
for comparison (Reprint with permission [7])
X-Ray Excited Fluorescent Materials for Medical Application
143
0
Concentration (#)
10
20
30
40
50
0
Concentration (#)
10
20
30
40
50
2.4
2.0
2.0
1.6
1.6
1.2
1.2
y (cm)
x (cm)
Au K
ab unpolarized 50 it
Au K
ab unpolarized 100 it
0.8
0.8
0.4
2.4
2.0
1.6
1.2
y (cm)
0.8
0.4
0.4
2.4
2.0
1.6
1.2
x (cm)
0.8
0.4
0
Concentration (#)
0
0.2
0.4
0.6
0.8
1
Concentration (#)
10
20
30
40
50
Au K
ab unpolarized 200 it
Au K
ab unpolarized FBP
2.4
2.0
1.6
1.2
y (cm)
0.8
0.4
2.4
2.0
1.6
1.2
x (cm)
0.8
0.4
2.4
2.0
1.6
1.2
y (cm)
0.8
0.4
2.4
2.0
1.6
1.2
x (cm)
0.8
0.4
2.4
0
Concentration (#)
10
20
30
40
50
0
Concentration (#)
10
20
30
40
50
2.4
2.0
2.0
1.6
1.6
1.2
1.2
y (cm)
x (cm)
Au K
ab polarized 50 it
Au K
ab polarized 100 it
0.8
0.8
0.4
2.4
2.0
1.6
1.2
y (cm)
0.8
0.4
0.4
2.4
2.0
1.6
1.2
x (cm)
0.8
0.4
0
Concentration (#)
0
0.2
0.4
0.6
0.8
1
Concentration (#)
10
20
30
40
50
Au K
ab polarized 200 it
Au K
ab polarized FBP
2.4
2.0
1.6
1.2
y (cm)
0.8
0.4
2.4
2.0
1.6
1.2
x (cm)
0.8
0.4
2.4
2.0
1.6
1.2
y (cm)
0.8
0.4
2.4
2.0
1.6
1.2
x (cm)
0.8
0.4
Fig. 4
Images reconstructed for the CZT large crystal geometry for unpolarized X-rays (upper row) and linear polarized X-rays (lower row). The images are
reconstructed with 50,100, and 200 iterations for both excitation modes. The images are scaled to a maximal concentration intensity of 50 (arb. units) to compare
the visibility of the 20 s
μg/ml target. The last column depicts the images reconstructed with
filtered-backprojection and CNR for the highest gold concentration
for comparison (Reprint with permission [7])
X-Ray Excited Fluorescent Materials for Medical Application
143