

6 Gas Chromatography Columns Using Ionic Liquids …
137
log k = c + eE + sS + a A + bB + l L
(6.3)
Here, K and k are the partition coefficient and retention factor, respectively. The
solute descriptors: E and R 2 , S and π
H
2 , A and α
H
2 , B and β
H
2 , and L and L
16 represent
the excess molar refraction, dipolarity, H-bond acidity, H-bond basicity, and gas–
hexadecane partition coefficient at 25 °C, respectively. The solute descriptor values
for more than 300 solutes are reported in the literature [33]. The phase constants e, s,
a, b, and l are a measure of the ability for the stationary phase or solvent to interact
with analyte or solute via π or nonbonding electrons, dipole–dipole interactions,
H-bond basicity, H-bond acidity, or dispersion forces, respectively. The equation
constant (c) does not define any fundamental property, but when the log k is used
as the dependent variable, it is dominated by the phase ratio for the column. The
retention factors (k) for every probe analyte/solute are measured experimentally,
and the phase constants are calculated by subjecting the data set to multiple linear
regression analysis (MLRA). Interaction parameters obtained from the LSER model
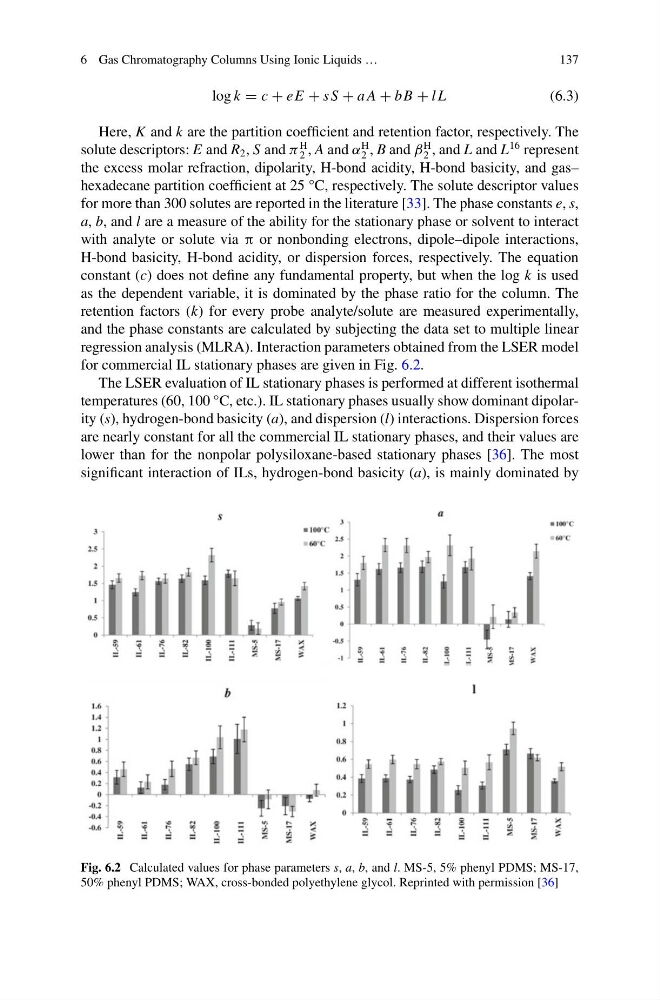
for commercial IL stationary phases are given in Fig. 6.2.
The LSER evaluation of IL stationary phases is performed at different isothermal
temperatures (60, 100 °C, etc.). IL stationary phases usually show dominant dipolarity (s), hydrogen-bond basicity (a), and dispersion (l) interactions. Dispersion forces
are nearly constant for all the commercial IL stationary phases, and their values are
lower than for the nonpolar polysiloxane-based stationary phases [36]. The most
significant interaction of ILs, hydrogen-bond basicity (a), is mainly dominated by
Fig. 6.2 Calculated values for phase parameters s, a, b, and l. MS-5, 5% phenyl PDMS; MS-17,
50% phenyl PDMS; WAX, cross-bonded polyethylene glycol. Reprinted with permission [36]
137
log k = c + eE + sS + a A + bB + l L
(6.3)
Here, K and k are the partition coefficient and retention factor, respectively. The
solute descriptors: E and R 2 , S and π
H
2 , A and α
H
2 , B and β
H
2 , and L and L
16 represent
the excess molar refraction, dipolarity, H-bond acidity, H-bond basicity, and gas–
hexadecane partition coefficient at 25 °C, respectively. The solute descriptor values
for more than 300 solutes are reported in the literature [33]. The phase constants e, s,
a, b, and l are a measure of the ability for the stationary phase or solvent to interact
with analyte or solute via π or nonbonding electrons, dipole–dipole interactions,
H-bond basicity, H-bond acidity, or dispersion forces, respectively. The equation
constant (c) does not define any fundamental property, but when the log k is used
as the dependent variable, it is dominated by the phase ratio for the column. The
retention factors (k) for every probe analyte/solute are measured experimentally,
and the phase constants are calculated by subjecting the data set to multiple linear
regression analysis (MLRA). Interaction parameters obtained from the LSER model
for commercial IL stationary phases are given in Fig. 6.2.
The LSER evaluation of IL stationary phases is performed at different isothermal
temperatures (60, 100 °C, etc.). IL stationary phases usually show dominant dipolarity (s), hydrogen-bond basicity (a), and dispersion (l) interactions. Dispersion forces
are nearly constant for all the commercial IL stationary phases, and their values are
lower than for the nonpolar polysiloxane-based stationary phases [36]. The most
significant interaction of ILs, hydrogen-bond basicity (a), is mainly dominated by
Fig. 6.2 Calculated values for phase parameters s, a, b, and l. MS-5, 5% phenyl PDMS; MS-17,
50% phenyl PDMS; WAX, cross-bonded polyethylene glycol. Reprinted with permission [36]